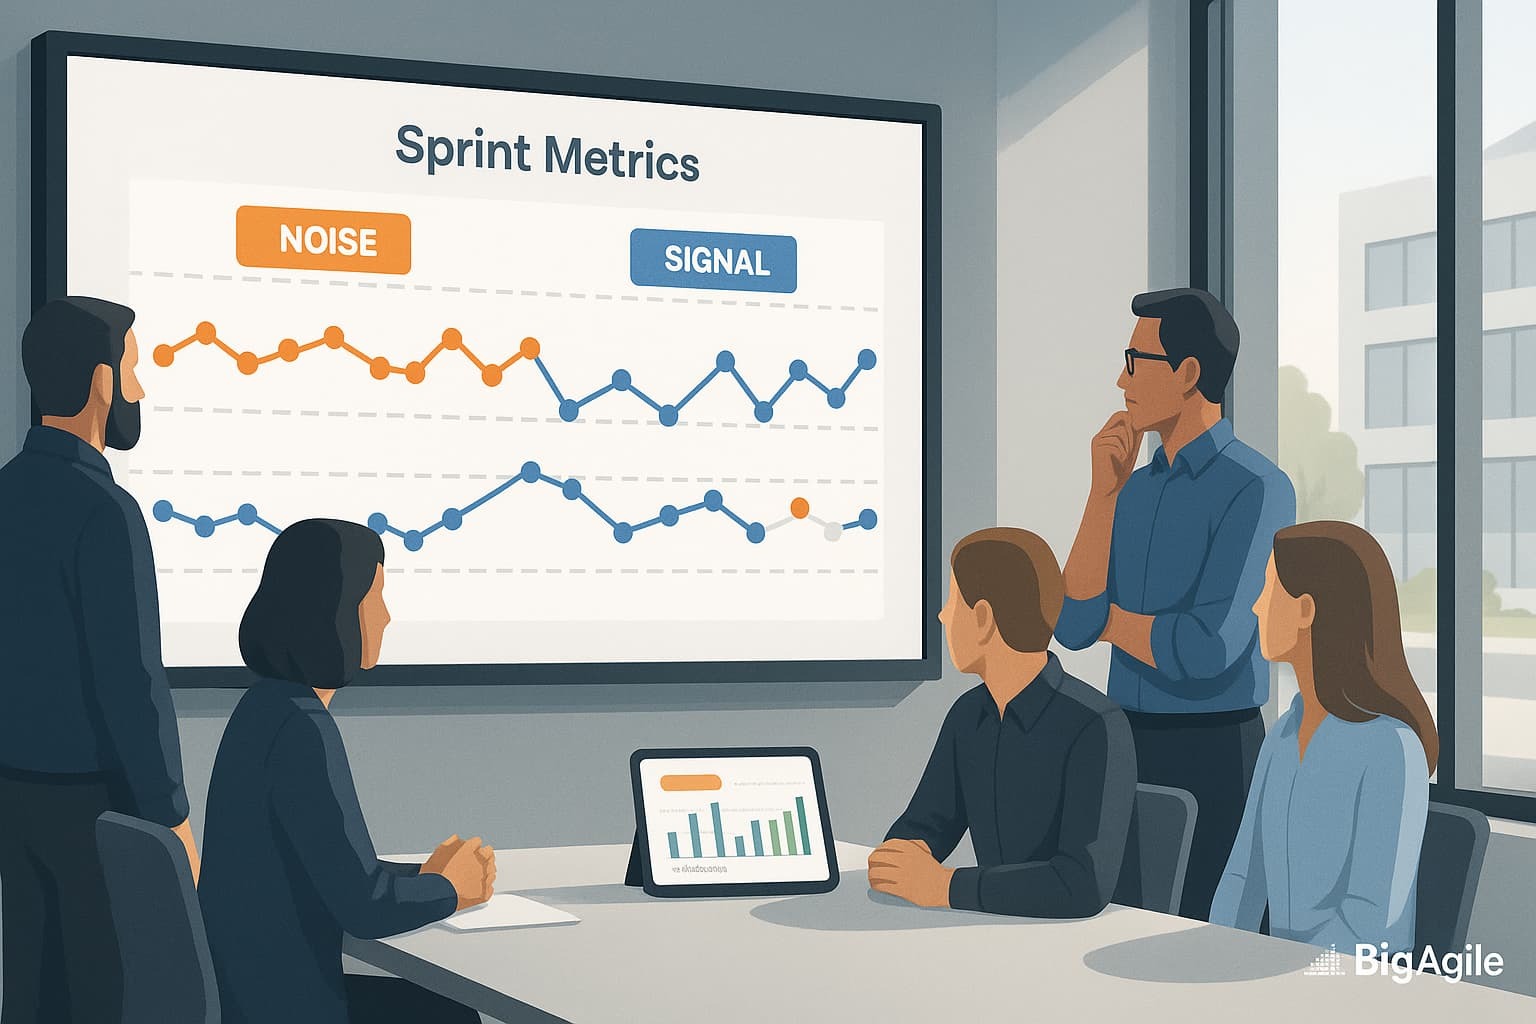
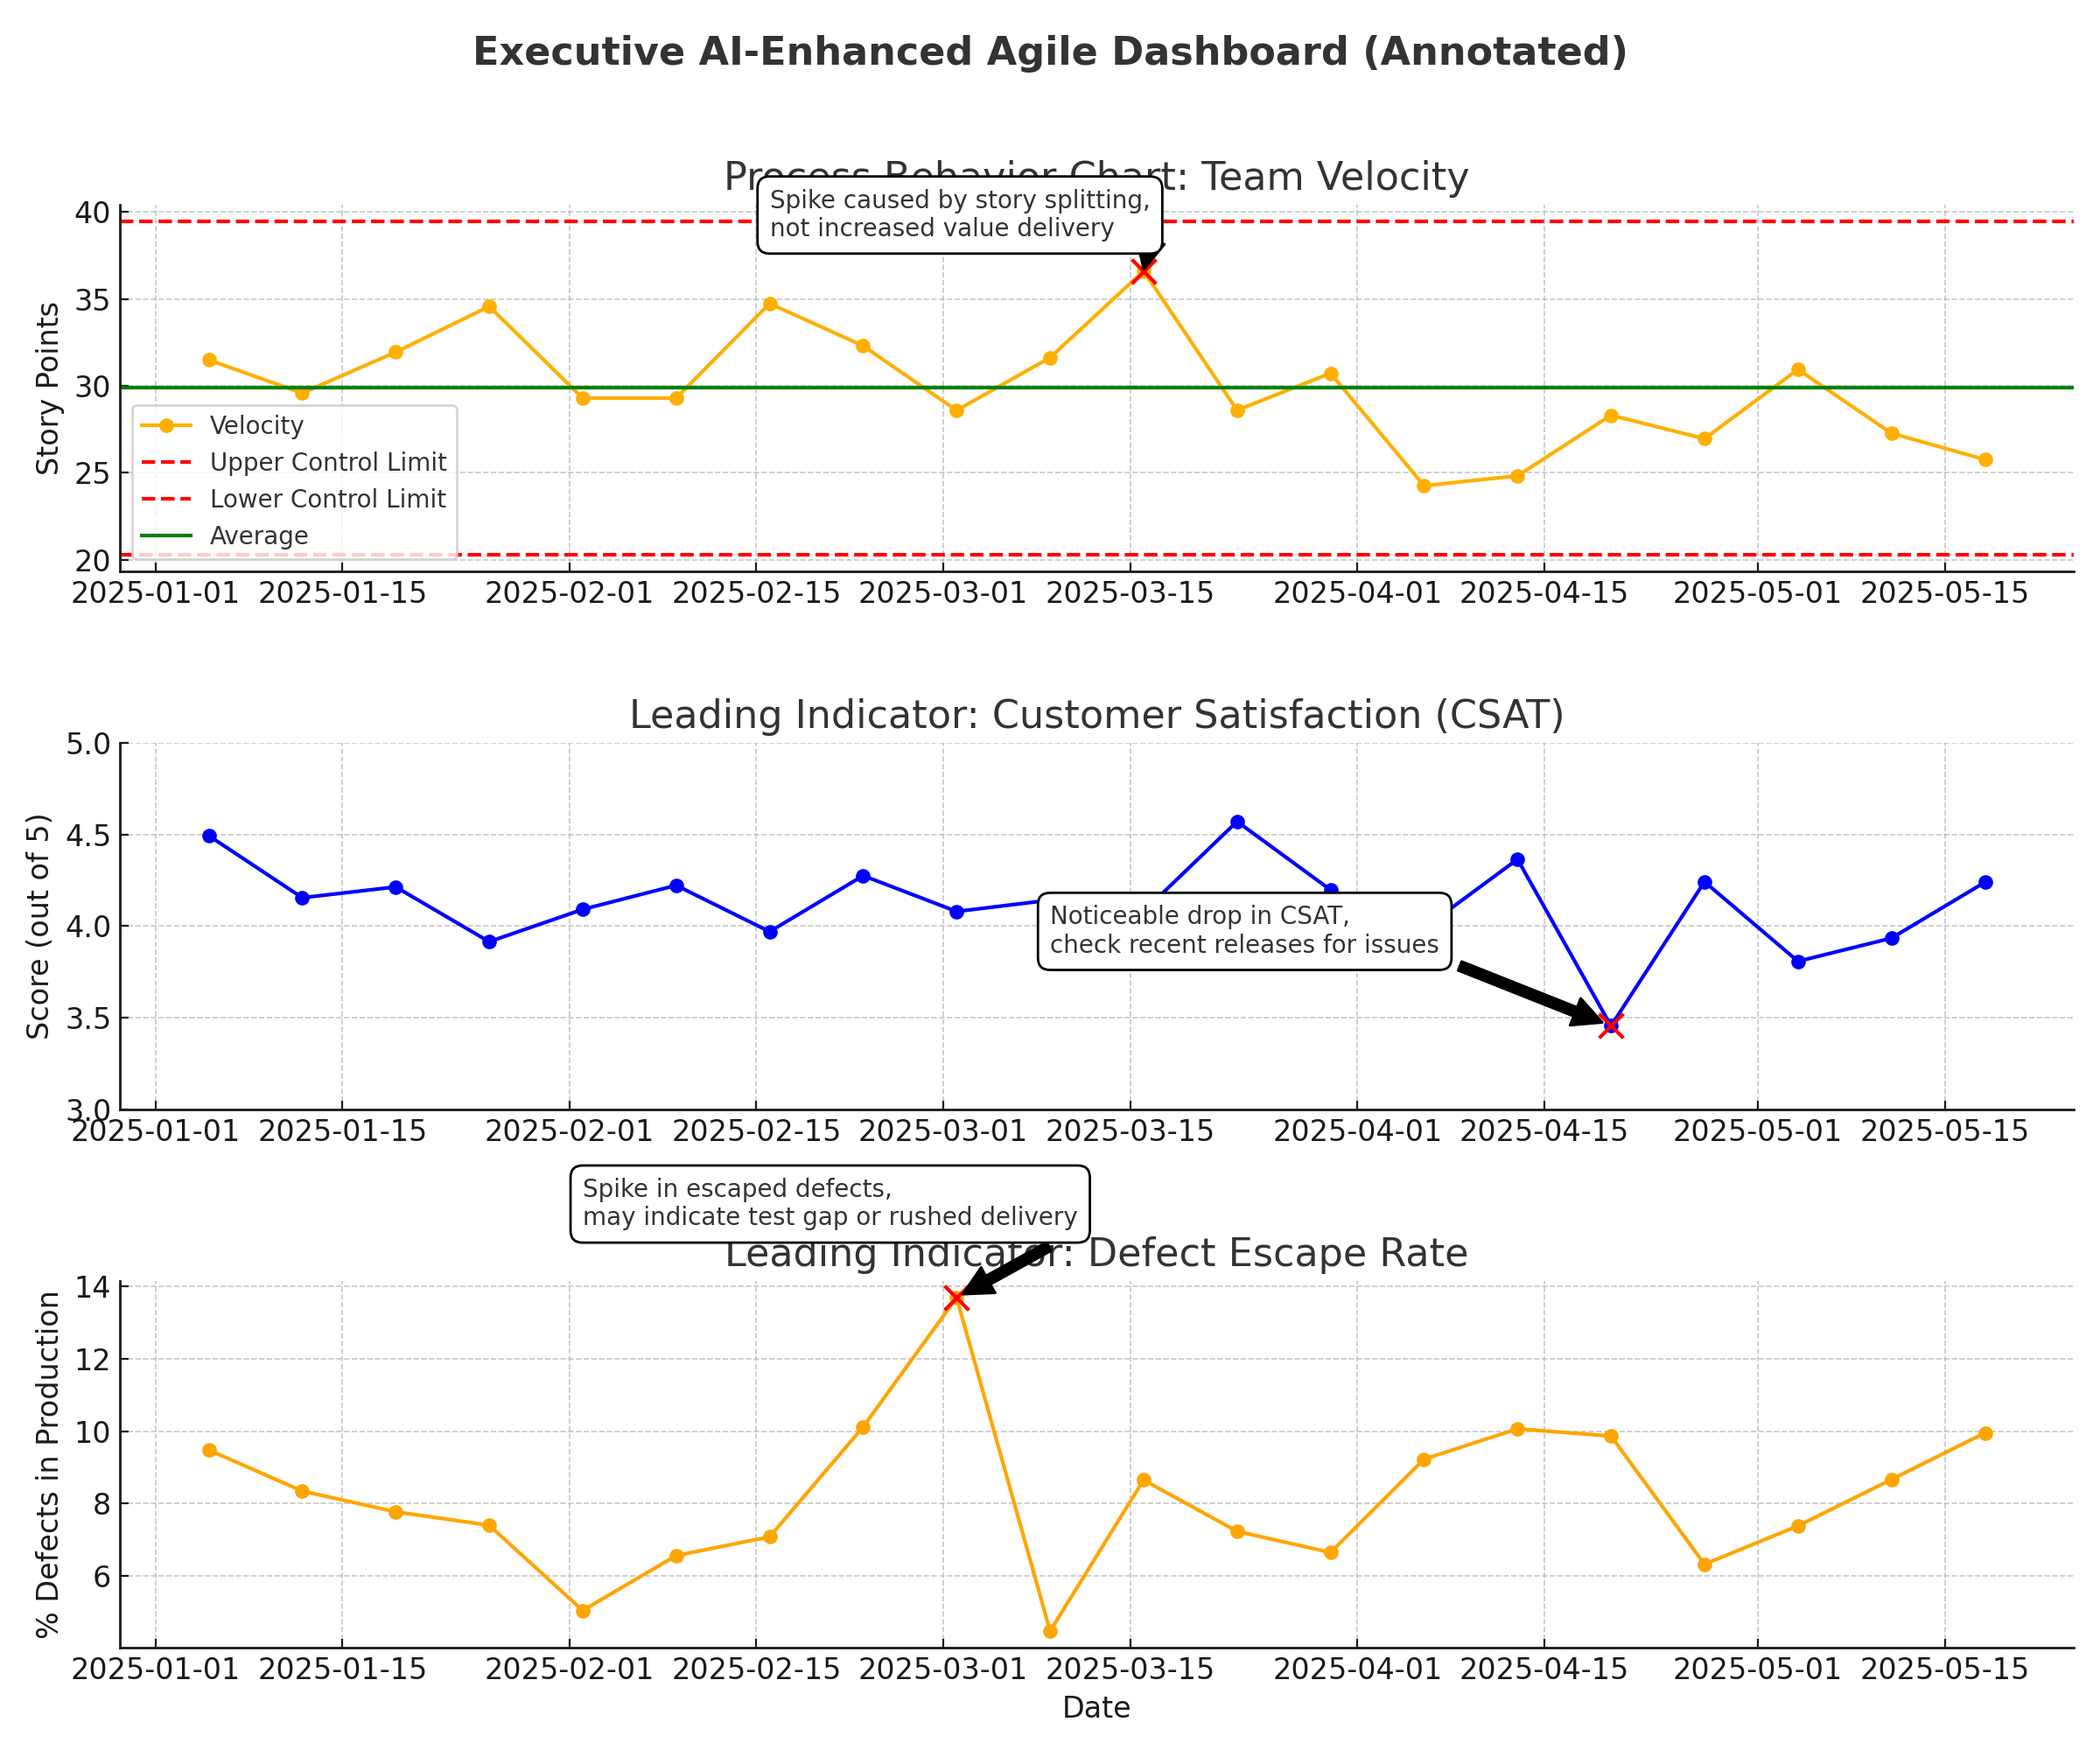
The leadership team was buzzing. The new AI-powered dashboard had just shown a sharp spike in the velocity forecast, and everyone took it as a sign that productivity had jumped. But a closer look revealed the truth: the increase came from splitting stories into smaller pieces; the team’s actual throughput of value hadn’t changed. What looked like a significant win was just a change in how work was measured. The excitement faded, replaced with a quiet realization: not all “good news” in the data is good.
While I celebrate that the team is breaking down stories into smaller parts, the bigger the story is, the more likely it is to grow. However, that doesn’t necessarily mean we deliver more value, just more output. Output isn’t necessarily bad, especially when it comes to flow, but that output should be connected to some meaningful business outcome.
What.
AI can turbocharge our access to metrics, delivering instant visualizations and predictive trends that feel authoritative. Believe me, I am a huge fan of metrics and predictions. But as Measures of Success reminds us, more data doesn’t always mean better decisions. In agile, it’s easy to mistake activity (more tickets completed, higher velocity) for progress (more valuable outcomes delivered). When AI puts those metrics in a sleek, real-time dashboard, the temptation to react to every blip gets even stronger, especially when the visuals make it look like the team is on a hot streak. Leaders typically salivate as they are keen to identify and minimize variances in business; we want those minimized, especially before the call with the “street”.
So What.
The risk isn’t just chasing vanity metrics; it’s allowing those metrics to drive the wrong behavior. A team praised for a velocity jump caused by smaller stories might double down on breaking work into meaningless fragments. Leaders, eager to keep the trend line up, may start pushing for visible movement rather than valuable outcomes. AI’s power to aggregate and analyze can make metric “noise” more seductive and more dangerous than ever before.
So here we are... the good news is that AI will help us process and visualize data more quickly... the bad news is that it might cause us to focus on the wrong things. It's like driving in the HOV lane; you’re moving much faster than everyone else, but you missed your exit and now you have to go 8-10 more in the wrong direction.
Now What.
To counteract this, design AI-enhanced metrics to guide learning rather than feed ego:
- Use process behavior charts to see if changes are meaningful or just normal variation.
- Focus on leading indicators of value delivery — customer satisfaction scores, defect escape rates, time-to-feedback, alongside traditional agile measures.
- Pair AI’s trend detection with deliberate human interpretation before taking action.
- Regularly review which metrics actually correlate with business outcomes and retire the rest. Retrospect the metrics!
This keeps the dashboard from becoming a scoreboard and instead turns it into a tool for continuous improvement.
Let's Do This!
The goal of AI in agile metrics isn’t to make the charts prettier; it’s to make the outcomes better. When we design dashboards to serve learning over vanity, we protect our teams from chasing the wrong wins and help leaders make decisions rooted in real progress. The smartest AI metric isn’t the flashiest, believe me, I've tried. It’s the one that tells you what to try next and the discussion that helps us figure that out.