
The Problem.
Your radar now shows what code is hot and how the team feels, but not why some work crawls while other items sprint to “Done.” Hidden queue time, invisible hand-offs, and ballooning WIP obscure where effort really waits. Without seeing those process peaks, teams often swarm the wrong hill or, worse, blame morale when the real issue is simply flow friction.
The Agility.
Business agility depends on shortening the idea-to-value cycle. Principles of Product Development Flow describe queue time as “the silent killer of predictability.” By combining Jira cycle-time and WIP counts into the Emergence Radar, we reveal those wait states along with code risk and team sentiment. The result: a single view that connects human stress, technical hotspots, and process drag, so you can select the right lever first.
The Scrum: Wire Flow Metrics in One Sprint.
| Step | Action | Command / Snippet |
|---|---|---|
| 1 | Create a Jira API token with read:jira-work scope. | export JIRA_TOKEN=abc123 |
| 2 | Pull cycle-time & WIP for the last 4 sprints. | python ingest_jira_flow.py --board 42 --sprints 4 --out data/flow.csv |
| 3 | Expose flow API in radar.py. | @app.route("/api/flow") → return avg_queue, avg_active per theme |
| 4 | Patch radar.js to render queue mountains (orange bars) behind commit dots. | See GitHub branch flow-day for full diff. |
| 5 | Run a 30-min swarm on the tallest mountain in stand-up. | Facilitator script in /docs/swarm.md |
Key extractor (ingest_jira_flow.py)
#!/usr/bin/env python3
# pip install atlassian-python-api pandas
import os, csv, argparse, pandas as pd
from atlassian import Jira
jira = Jira(url="https://yourdomain.atlassian.net",
            token=os.getenv("JIRA_TOKEN"), cloud=True)
def cycle_time(issue):
    hist = issue['changelog']['histories']
    dates = {h['items'][0]['toString']: h['created'] for h in hist}
    return (pd.to_datetime(dates.get('In Progress')) -
            pd.to_datetime(dates.get('Selected for Development'))).days
def main(board_id, sprints, out):
    issues = jira.get_board_issues(board_id, maxResults=500,
                                   fields="summary,labels")
    rows=[]
    for i in issues['issues']:
        rows.append({
            "key": i['key'],
            "theme": (i['fields']['labels'] or ['Misc'])[0],
            "queue": cycle_time(i),
            "active": i['fields'].get('customfield_timeinprogress',0)
        })
    pd.DataFrame(rows).to_csv(out, index=False)
    print(f"✅ flow.csv written → {out}")
if __name__ == "__main__":
    p=argparse.ArgumentParser()
    p.add_argument("--board", type=int, required=True)
    p.add_argument("--sprints", type=int, default=4)
    p.add_argument("--out", default="data/flow.csv")
    main(**vars(p.parse_args()))
The Outcome.
Queue peaks show in orange behind red-risk commit blobs; mood halos turn yellow when waiting work frustrates devs. In pilot teams, the tallest mountain pointed to a Payments code-review backlog: a two-hour mob cleared 80% of tickets, and the next sprint’s joy score jumped 0.7 points. Bottlenecks become clear, swarm sessions become precise, and defect-escape rates decrease within two sprints.
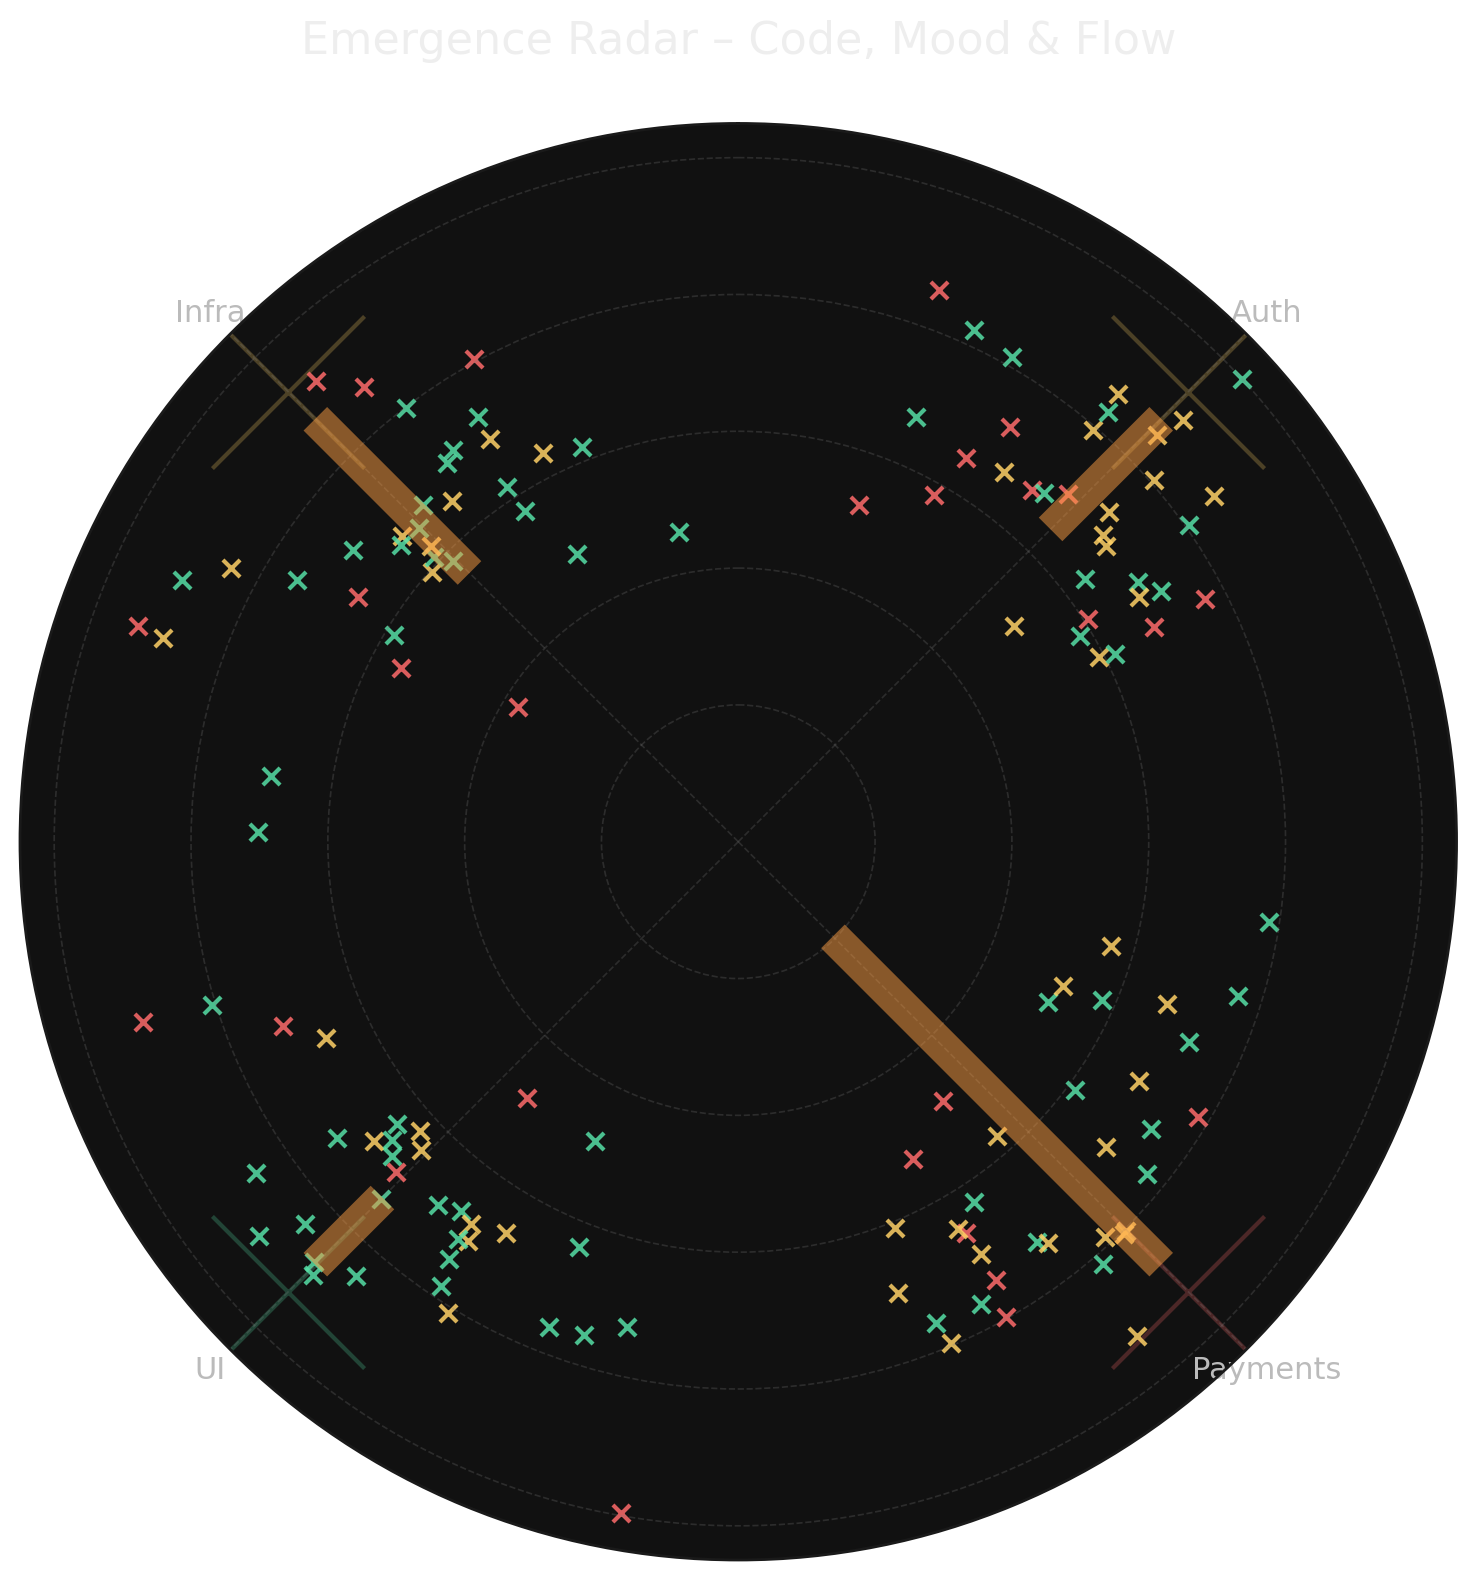
How to interpret it:
- Colored dots = individual commits (green = low risk, amber = medium, red = high).
- Translucent halos = team-mood indicators by theme (green good, amber okay, red stressed).
- Orange “mountains” = average queue days (taller means longer wait).
- Payments shows the steepest mountain (≈ 7 days) and the reddest halo → frustrating backlog.
- UI has a small mountain and a bright-green halo → smooth workflow, high morale.
What to do:
- Focus on the tallest mountain first – organize a 30-minute group review on the Payments code queue.
- Pair coaching with mood checks – check in with Payments developers; address stress triggers early.
- Borrow effective habits – ask the UI team how they keep queues low; apply their methods in Auth and Infra.
A quick glance reveals where work is stuck, who feels the pressure, and which hotspot to prioritize in the next sprint.
Let’s Do This!
By integrating cycle-time and WIP into the Emergence Radar, you convert scattered metrics into a clear, actionable view.