This week, we have been exploring real-world scenarios at an organization where I worked; they were a retail provider. While I spent most of my time in the technology operations of the retailer, our product was more than just tech, so I often found myself having to pull myself out of a sub-optimized mentality and help the organization focus on our actual end-customer.
Monday update was as upbeat as you can have on Monday; “feature count up 35 percent; weekly.” Marketing queued a new promo; support braced for the resulting traffic.
By Wednesday, chats and tickets spiked; customers could not use several features because the payments partner had a fixed two-week release cycle, and integration fixes missed our window.
Inside the organization, dashboards showed momentum; inside the third-party partner, capacity and cadence were unchanged. The problem was not effort; it was measurement. We were counting what shipped locally, while there wasn’t anyone tracking how value flowed across the network (partners included).
What?
Ecosystem agility needs flow signals that make sense across teams and orgs; not simply just "vanity" reports. I like to start with a small, shared set:
End-to-end lead time; customer request to customer-available across company boundaries.
Arrival rate vs throughput per boundary; if arrivals exceed a partner’s throughput, queues and frustration grow.
WIP aging by boundary; how long items wait in “with partner” states; aging reveals the real bottleneck.
First-time-through quality at handoffs; percent of changes accepted without rework by the next company.
Time-to-recover from an incident or failed deploy across firms.
Ecosystem decision latency: clock time from “exception detected” to “cross-company decision made.”
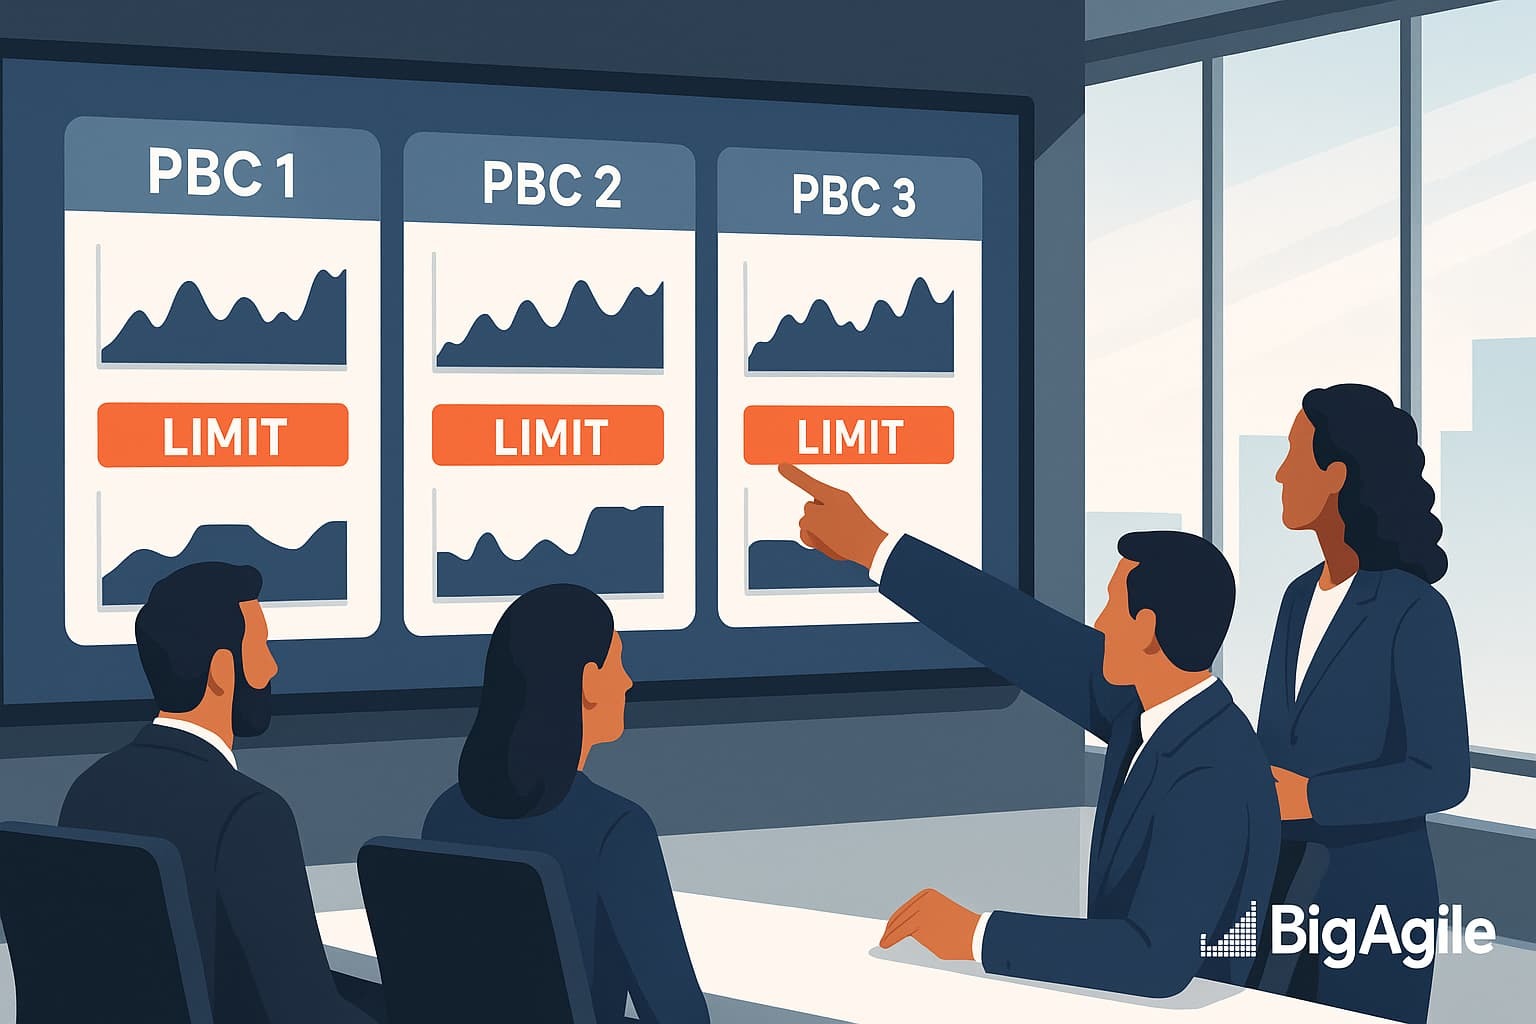
Plot Process Behavior Charts (PBCs) for end-to-end lead time and time-to-recover; use XˉXˉ and limits Xˉ±2.66×MR‾Xˉ±2.66×MR to separate signal from noise. Use variability and queueing economics to explain why big batches and uneven arrivals explode wait times; then we can size experiments accordingly.
Track a joint defect escape rate at the integration boundary; this is often the pulse of cross-company quality.
So What?
Acting on noise creates organizational whiplash; new rituals pile up; relationships strain; customers feel the churn. Acting on signals creates predictability; partners pace work to real capacity; arrivals are smoothed; fixes batch into the next reliable release; exceptions are handled in one cadence.
Flow metrics turn blame into design; you stop asking “who failed” and start asking “what policy or queue shape produced this wait.”
Now What?
Stand up three shared PBCs and a 15-minute weekly review with your primary partner:
Pick the three: end-to-end lead time, time-to-recover, and joint escaped defects. Collect 20–30 points, then compute XˉXˉ, MR‾MR, limits.
Define the seams: document where data hands off, who timestamps start and finish, and how you will log events when a policy changes or an outage occurs.
Run the review; same time each week; agenda:
Signals first; any point outside limits; any 8-point shift; any 6-point trend.
One exception to resolve; decision rights clear; owner named; due date set.
One improvement to try; e.g., cap arrivals to match partner throughput; add a small “fast track” lane; reduce release batch size at the seam.
Act only on signals; if there is no signal, log the observation; do not change anything.
Translate signals to portfolio choices; if arrivals exceed partner throughput, reduce starts; do not add multitasking; if time-to-recover is outside limits, invest in joint rollback or shared test data; measure again next week. The more we change at one time, the harder it is to troubleshoot if there are problems AND fixing one thing at a time might expose bottlenecks you wouldn't otherwise see.
Let's Do This! (together)
Flow beats frenzy; across companies, even more than within one.
When leaders install a few shared signals and a calm review cadence, metrics stop being performance theater and become the language of partnership.
Choose end-to-end lead time, time-to-recover, and joint escape rate; act only on true signals; align portfolio decisions to real capacity; your ecosystem will feel steadier within weeks, and your customers will notice first. In this post, I am just giving examples we had on our team; if these metrics don't make sense, pick your own.