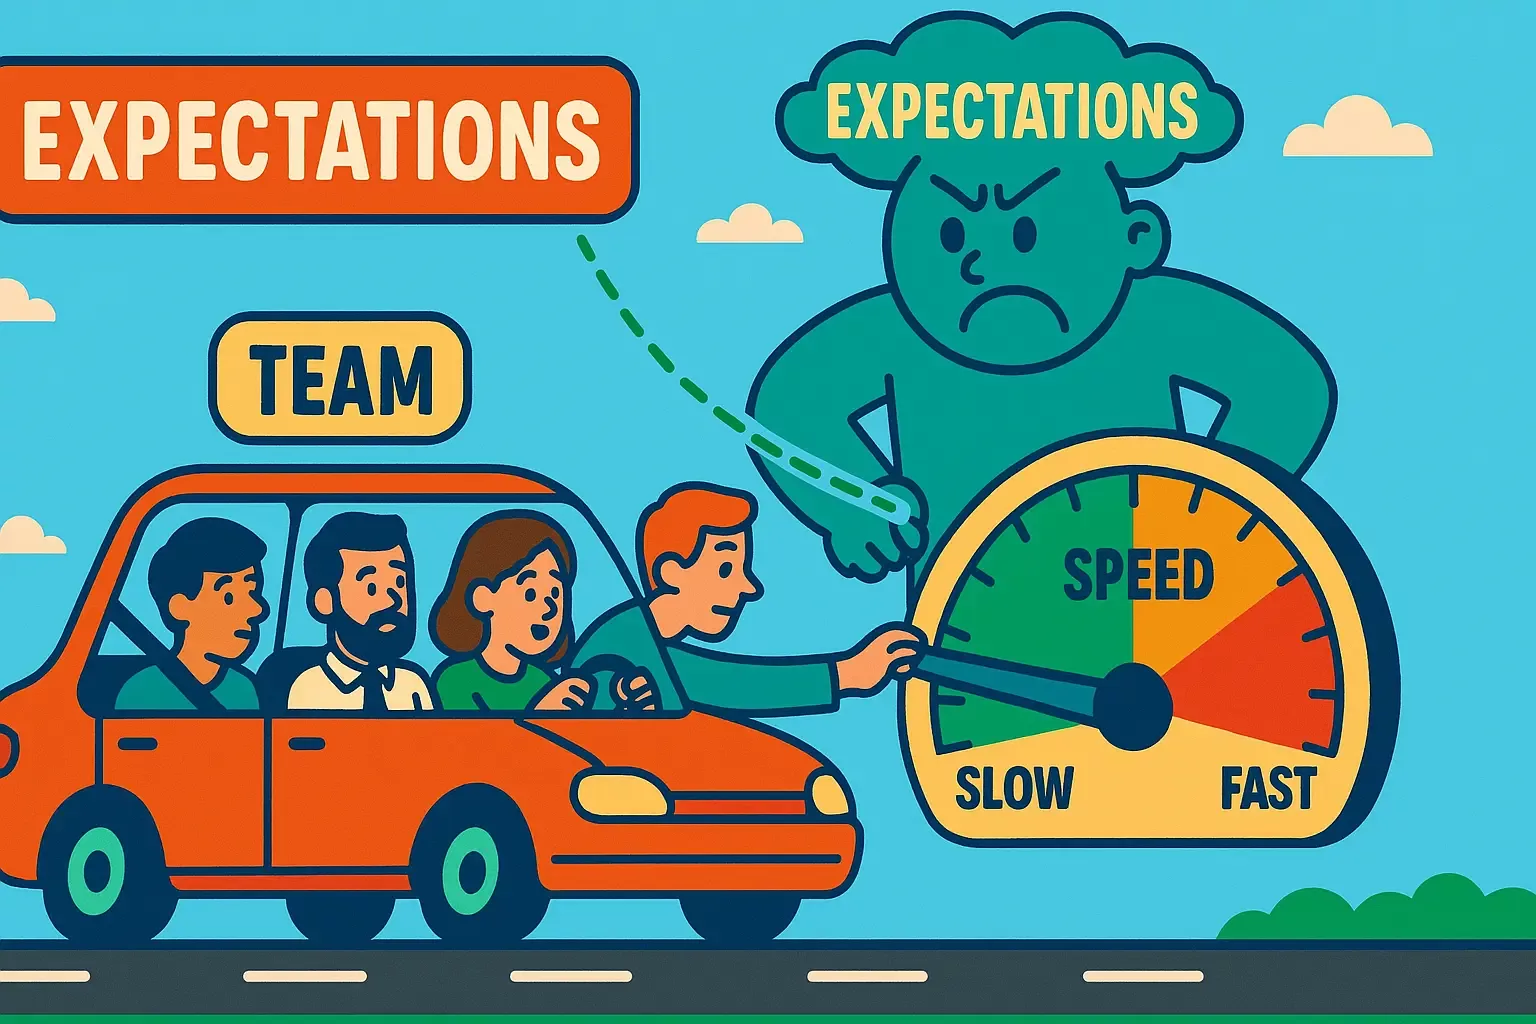
Velocity is best used as a planning tool—helping teams forecast how many story points they can realistically complete in an upcoming iteration. Think of it like a car’s speedometer: it tells you how fast you’re moving, but not whether you’re headed in the right direction or whether you’re delivering anything worthwhile.
Mini Case Study:
Imagine a Scrum team that regularly completes 30 points per sprint. Stakeholders start praising them for their “high velocity,” so the team inflates estimates to show a jump to 35 points because it feels good to get praised. Suddenly, it looks like they’ve improved their output overnight. But in reality, the “improvement” is a mirage—fueled by an artificial inflation of story points rather than real gains in productivity or product quality. This is one of many ways velocity can be misused when it’s treated as an external performance benchmark.
Common Pitfalls of Misusing Velocity as a KPI
1. Inflated Estimates
When velocity becomes a high-stakes number—tied to performance reviews or executive reporting—teams may start inflating story point estimates. Over time, velocity becomes meaningless, and trust erodes.
2. Neglect of Strategic Goals
Teams may prioritize “quick wins” to bump up velocity, neglecting more complex tasks that actually move the needle on business objectives. This short-term thinking can stall product innovation and strategic alignment.
3. Scope and Quality Compromises
Racing to “complete more points” sometimes means cutting corners on testing or ignoring technical debt. This can lead to increased defects and rework down the road, negating the perceived gains in speed.
4. Unhealthy Competition and Burnout
Pitting teams against each other based on velocity can create a toxic culture. Instead of collaborating to solve larger problems, teams compete to inflate their numbers, leading to stress and burnout.
A Better Approach: Layered Agile Metrics
To avoid these pitfalls, a multi-tiered metrics framework should be adopted. Rather than relying on velocity alone, layer your metrics as follows:
Business-Level Metrics – Align with Strategic Goals
- Revenue Growth or Market Share – Reflects overall financial success.
- Customer Satisfaction (NPS) or Churn Rate – Measures whether you’re keeping customers happy and engaged.
- Outcome-Focused OKRs – Objectives and Key Results that capture big-picture priorities, such as “Reduce churn by 20%” or “Increase market share in enterprise clients by 10%.”
Product Group Metrics – Focus on Cross-Functional Value Streams
- DORA Metrics (Deployment Frequency, Lead Time, Change Failure Rate, Mean Time to Restore) – Provide insight into delivery speed and stability.
- Usage & Adoption (Daily Active Users, conversion funnels) – Indicate whether you’re delivering the right features in a way that resonates with users.
- Cross-Team Collaboration (Dependency resolution time) – Highlights how quickly teams coordinate to deliver end-to-end value.
Team-Level Metrics – Operational Health and Delivery
- Velocity – Use it as an internal capacity indicator, not a performance grade.
- Cycle Time – Measures the duration between starting a user story and completing it.
- Quality Checks (Defect rates, test coverage) – Ensures speed doesn’t come at the expense of quality.
- Team Morale & Safety – Surveys on collaboration and psychological safety foster sustainable growth.
How to Shift Your Metric Focus Tomorrow
- Run a Retrospective on Existing Metrics
- Ask your team: “Which metrics do we find most and least valuable? Why?” Use this input to refine or remove metrics that don’t drive meaningful decisions.
- Start Tracking a Few Key DORA Metrics
- Even if your product group isn’t fully DevOps-driven, try measuring Deployment Frequency or Lead Time for Changes. Start small and expand as you see the benefits.
- Conduct an OKR Alignment Workshop
- Invite key stakeholders and team leads to a session where you align team goals with business objectives. Clearly define how each team’s work contributes to outcomes like customer satisfaction or revenue growth.
- Combine Quantitative and Qualitative Data
- Pair velocity (quantitative) with feedback from stakeholders and users (qualitative). Discuss how user feedback maps to your sprint or release goals.
- Share Success Stories to Reinforce Good Practices
- Recognize teams that balanced strong velocity with high-quality deliverables or that tackled challenging but valuable features. Emphasize real value over raw speed.
Useful Resources
- Scrum Guide (Scrum.org or Scrum Alliance): Foundation of Scrum principles and practices.
- Accelerate by Nicole Forsgren, Jez Humble, and Gene Kim: Deep dive into the DORA metrics that drive high-performing technology organizations.
- State of DevOps Reports: Annual studies offering data on how DORA metrics correlate with organizational performance.
- Objectives and Key Results (OKRs) Framework (Various Sources): Google pioneered this method; many case studies highlight how OKRs link daily work to higher-level outcomes.
So What?
Velocity, when viewed in isolation, can create a false sense of progress and lead to counterproductive behaviors. By embracing a layered metrics approach—tying daily work to product objectives and overarching business goals—you get a more accurate picture of both what is being delivered and why it matters.
Steer clear of velocity as your primary Key Performance Indicator. Instead, adopt a balanced view that incorporates DevOps performance metrics, business outcomes, and team health indicators. Your teams will stay focused on delivering true value, and the entire organization will benefit from a more genuine, data-driven form of agility.