You now have a handful of thin, telemetry-ready stories born from real usage signals. The next question is “Which ones cut the coming Sprint?”
Weighted Shortest Job First (WSJF) started as a lean-economics scheduling rule. Don Reinertsen introduced it in The Principles of Product Development Flow (2009) to maximize economic return by sequencing work with the highest Cost of Delay divided by duration. Frameworks like SAFe later popularized WSJF for agile portfolios, encouraging teams to stack-rank epics by relative Cost of Delay rather than HiPPO opinion.
By the mid-2010s, product teams realized WSJF’s maths still left room for guesswork: two features could share the exact Cost of Delay yet be backed by wildly different levels of evidence. Enter the confidence multiplier, borrowed from RICE and ICE scoring models, which explicitly weights an idea’s data strength alongside impact and effort.
Blogs in the lean-product community began blending the approaches, giving high-fidelity metrics (e.g., Mixpanel funnel) more sway than just hallway conversations. The result is often called Evidence-Based WSJF or “WSJF × Confidence,” where Impact × Confidence ÷ Effort replaces the original numerator, tilting priorities toward slices already grounded in usage data.
Today, this hybrid model anchors modern discovery practices championed by continuous-delivery shops: capture objective signals, convert them to hypotheses, slice stories thin, then score them with impact, confidence, and effort. Evidence-weighted WSJF preserves the economic rigor of Reinertsen’s formula while reinforcing a data-driven culture, ideas earn priority by proving they’re real problems with real upside before the team writes a single line of code.
The Three Core Factors.
| Factor | How to Score (1-10) | Quick Calibration |
|---|---|---|
| Impact (Cost of Delay) | Revenue upside, churn reduction, strategic OKR alignment | Use $ or % targets from product-goal column |
| Effort (Job Size) | Developer-days or story points | Use your team’s existing sizing scale |
| Confidence (Evidence Weight) | Strength of the data that triggered the story | 1–3 = gut feel · 4–7 = anecdotal/qual · 8–10 = quantified usage metric |
Formula: WSJF = (Impact × Confidence) ÷ Effort
A modest impact story with iron-clad evidence can outrank a moon-shot guess that lacks data.
Scoring the Export-Flow Slices
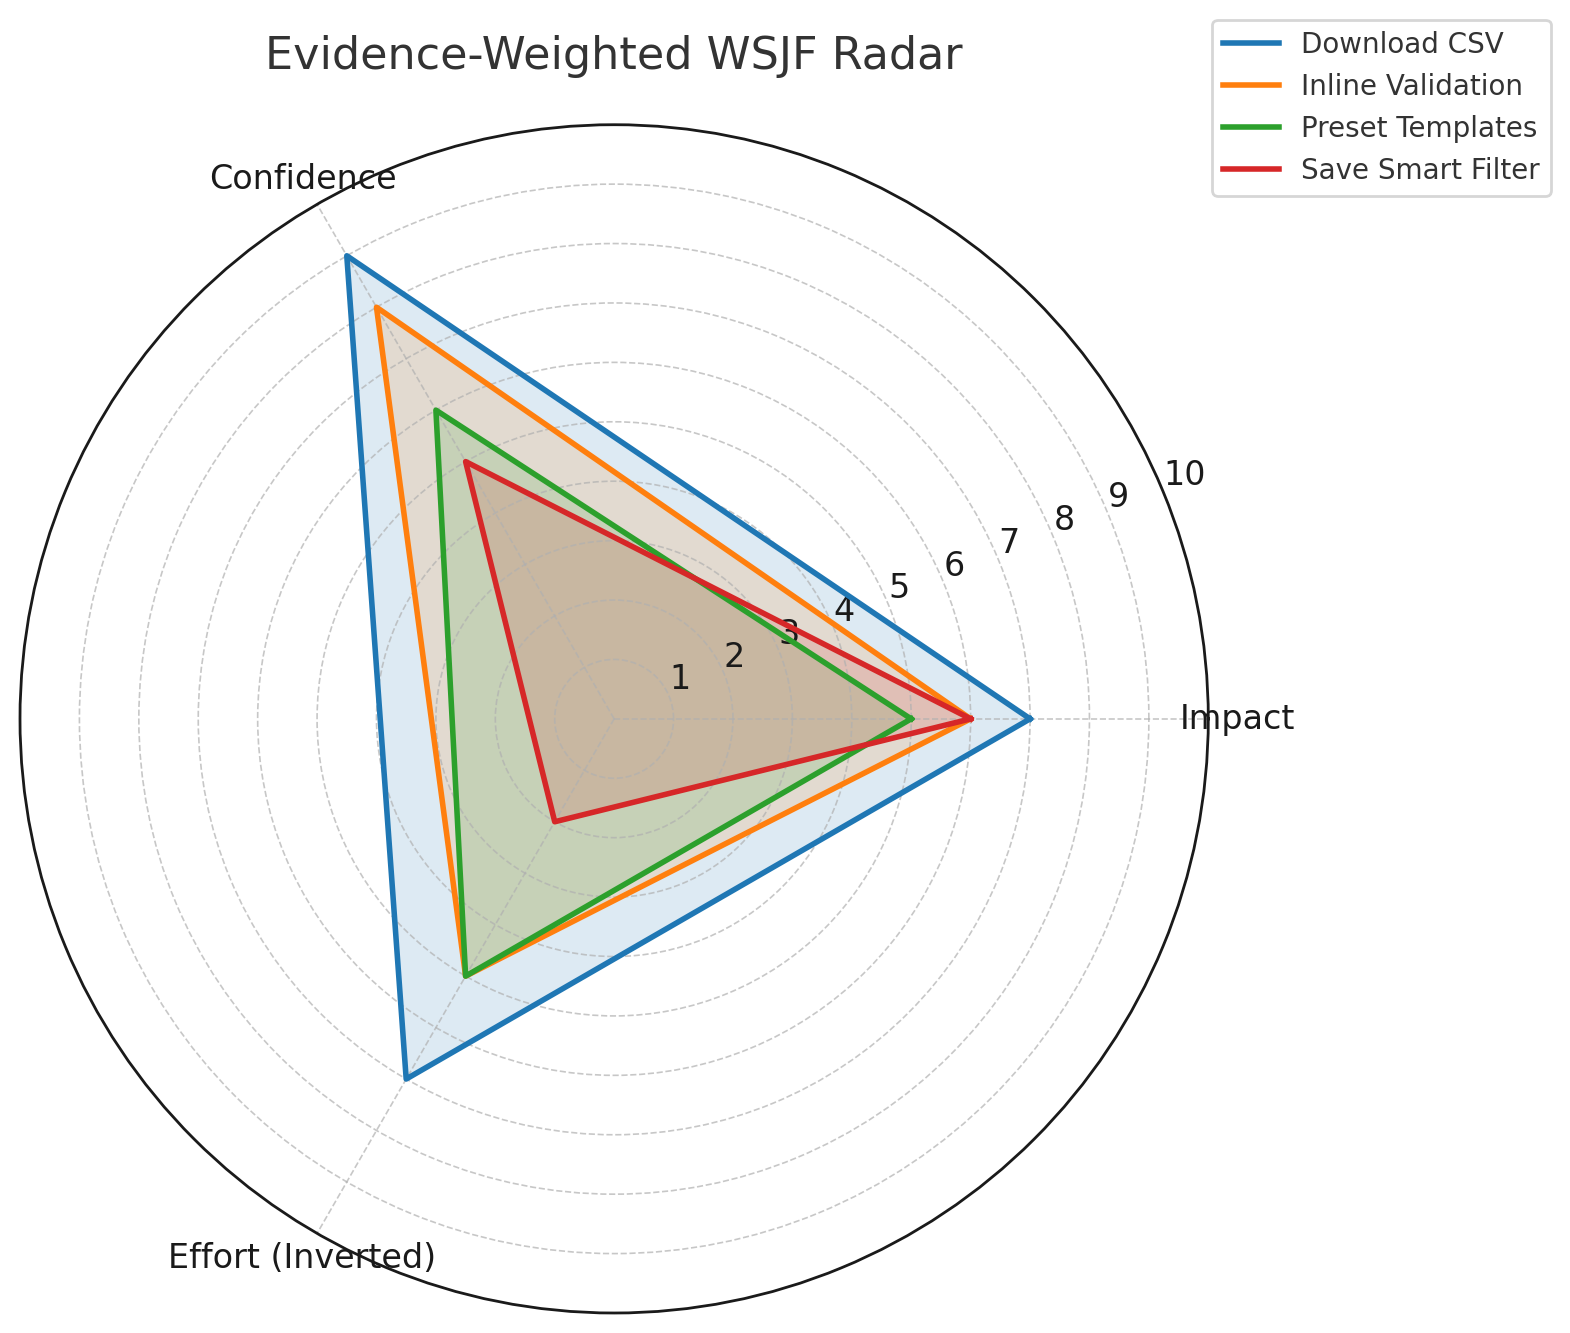
| Story | Impact (1-10) | Confidence (1-10) | Effort (1-10) | Evidence-Weighted WSJF |
|---|---|---|---|---|
| Add prominent Download CSV button | 7 | 9 | 3 | 21.0 |
| Inline validation & error copy for filters | 6 | 8 | 5 | 9.6 |
| Surface preset filter templates | 5 | 6 | 5 | 6.0 |
| Add “Save Smart Filter” quick-reapply | 6 | 5 | 8 | 3.8 |
Reading the Radar.
Plot these scores on a simple 3-axis radar (Impact, Confidence, Effort inverted). The slice with the largest filled area, our CSV button, earns top priority. Tools like Jira Product Discovery, Airtable, or a lightweight Google Sheet can auto-generate the radar; copy-paste numbers, let the chart render, and drop it into the Sprint-planning deck.
Facilitating the Conversation.
- Share numbers before the meeting so debate centers on deltas, not guessing games.
- Start with Confidence. If the data is weak, consider running a spike instead of building the feature.
- Stress that scores are directional, good for choosing “next three items,” not perfect rank ordering of the universe.
Evidence weighting nudges teams toward slices that already have telemetry, reinforcing a culture where ideas earn their place with facts.
Let’s Do This!
Tomorrow we close the loop. In Friday’s post, you’ll learn how to dark-launch the top slice behind a feature flag, track the metric shift in real time, and decide to iterate, pivot, or park the work before Sprint Review. The reward is a backlog that gets smarter every iteration and a team that spends more time delighting users than debating priorities.
Bring your highest-weighted slice and get ready to watch the dashboard move!