Yesterday, *hopefully* you wired the product for truth. You have five clean baseline metrics and a dashboard that finally says more than “ship faster.” Today, we move to the middle of the loop, the translation step that turns data into decisions.
This is where many teams stall: they stare at a funnel cliff, shrug, and add “polish export flow” to the backlog. Instead, we will frame a concrete user-problem hypothesis, tie it to a measurable business goal, and draft a razor-thin story that can live or die inside a single Sprint. By the end of this post, you will have a repeatable worksheet—Metric → Insight → Story—that slots neatly into refinement and Sprint Planning, giving every backlog item a “why” that the whole squad can recite.
Locking this practice now sets us up for tomorrow, when we slice each story even thinner, embed telemetry in the acceptance criteria, and walk into Sprint Planning with work that is already instrumented for learning. Grab yesterday’s dashboard and a notepad, and let’s convert signals into stories.
The workflow has three simple steps:
- Metric → Insight: Identify a meaningful pattern and formulate a user-problem hypothesis.
- Insight → Product Goal: Link that hypothesis to an outcome important to the business.
- Product Goal → Backlog Story: Draft a concise, testable slice that can validate (or disprove) the idea within one Sprint.
Use this loop every time you update the backlog; the more often you run it, the easier it becomes.
Metric → Insight.
Begin with your dashboard, not the roadmap. Review yesterday’s charts for gaps, cliffs, or plateaus. Two quick heuristics help differentiate noise from signal:
- Delta heuristic: Look for a week-over-week change of 10 percent or more.
- Benchmark heuristic: Compare against SaaS medians, less than 40% adoption, less than 80% task success, or more than 40% drop-off are common red flags.
Example
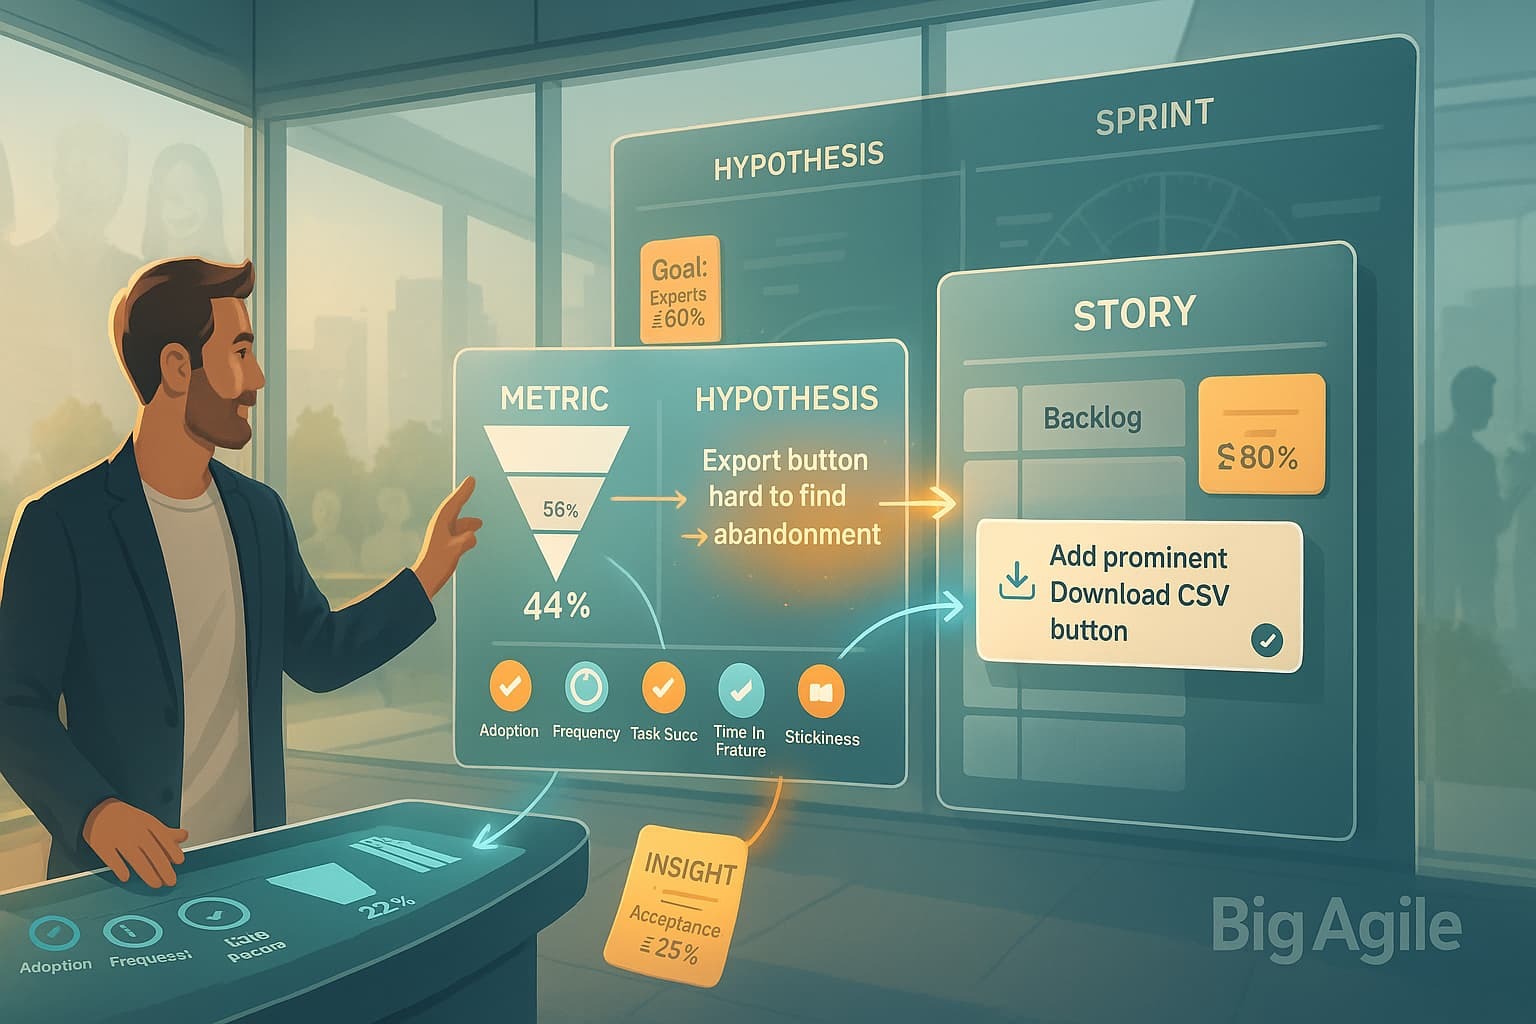
Smart Filter shows a 44% drop-off between “Apply Filter” and “Export CSV.” That is a delta worth investigating. We can rrame a hypothesis in a single sentence.
“Analysts cannot find a clear export button, so they abandon the flow.”
Keep it falsifiable; if usability tests show analysts do see the button, the hypothesis is disproven, and you move on.
Insight → Product Goal.
A hypothesis is valuable only if the outcome matters. Link it to an OKR, North-Star, or revenue lever.
- Revenue tie-in: More successful exports encourage upgrades to paid tiers.
- Experience tie-in: Reducing friction improves Net Promoter Score.
- Efficiency tie-in: Support tickets decrease when the flow is straightforward.
Write the goal with a metric, a target, and a deadline:
“Increase successful exports to 80 percent by Q4.”
This clarifies why the improvement is essential to the team.
Product Goal → Backlog Story.
Convert the goal into the simplest possible user story that can be delivered and measured within a Sprint.
As an analyst
I need a prominent indicator that allows me to download the data on the results page
So I can export filtered data without hunting through menus.
Add just enough acceptance criteria to confirm or refute the hypothesis:
- The button is visible without scrolling on desktop and mobile.
- Five analysts exported data in under 20 seconds during a hallway test.
- Funnel drop-off at Export falls below 25 percent within two days of launch.
Track the button click with Feature Used so Tuesday’s metric aligns with Friday’s report.
Putting It All Together
| Metric Signal | Hypothesis | Product Goal | Thin Backlog Story | Acceptance Check |
|---|---|---|---|---|
| 44% drop-off at Export | Export UI unclear | Exports ≥ 80 % by Q4 | Add prominent “Download CSV” button on results page | Funnel drop-off ≤ 25% within 48 h of release |
| 68% task success on filter apply | Validation errors confuse users | Task success ≥ 90% | Add inline error copy; disable Apply until inputs valid | Error rate ≤ 5% in A/B cohort |
| Median time-in-feature 38 s, P95 160 s | Experts spend too long tweaking filters | Reduce P95 by 30% | Surface top-3 preset templates above filter panel | P95 ≤ 110 s one week after launch |
| Stickiness 22% at 7 days | Feature not part of daily workflow | Stickiness ≥ 35% | Offer “Save Smart Filter” with one-click reapply | Stickiness +10 pp after 14 days |
Next Step.
Modern product management operates at the intersection of evidence, empathy, and execution.
Analytics tools like Mixpanel and Amplitude automate the evidence aspect, quickly identifying adoption gaps, funnel drop-offs, and engagement plateaus, allowing product leaders to focus their limited energy on areas where algorithms fall short: understanding the human story behind each metric.
By cycling through the Metric → Insight → Story process, you practice the same discovery and delivery rhythm advocated by Teresa Torres’ Continuous Discovery Habits, Marty Cagan’s empowered-team model, and SAFe’s evidence-based portfolio management. You form hypotheses based on usage data, test them with small, measurable slices, and document a clear chain from customer behavior to business outcomes.
Looking ahead, we plan to advance this approach further. We will integrate telemetry directly into each story’s Definition of Done, break work into even smaller pieces for rapid learning, and demonstrate how feature flags and experimentation platforms maintain the feedback loop without hindering delivery.
Tools handle data tracking; empowered teams interpret the insights. By delegating data collection to the platform, product experts can free up time to observe customer sessions, conduct empathy interviews, and identify emotional friction that numbers alone cannot reveal. Join us Wednesday for the post “From Insight to Story Slice” to see how combining analytics with human insight helps create products customers love.