Sprint Review reports were green, yet releases kept missing the mark. In the quarterly review, a VP asked,
“Where is the work actually getting stuck?”
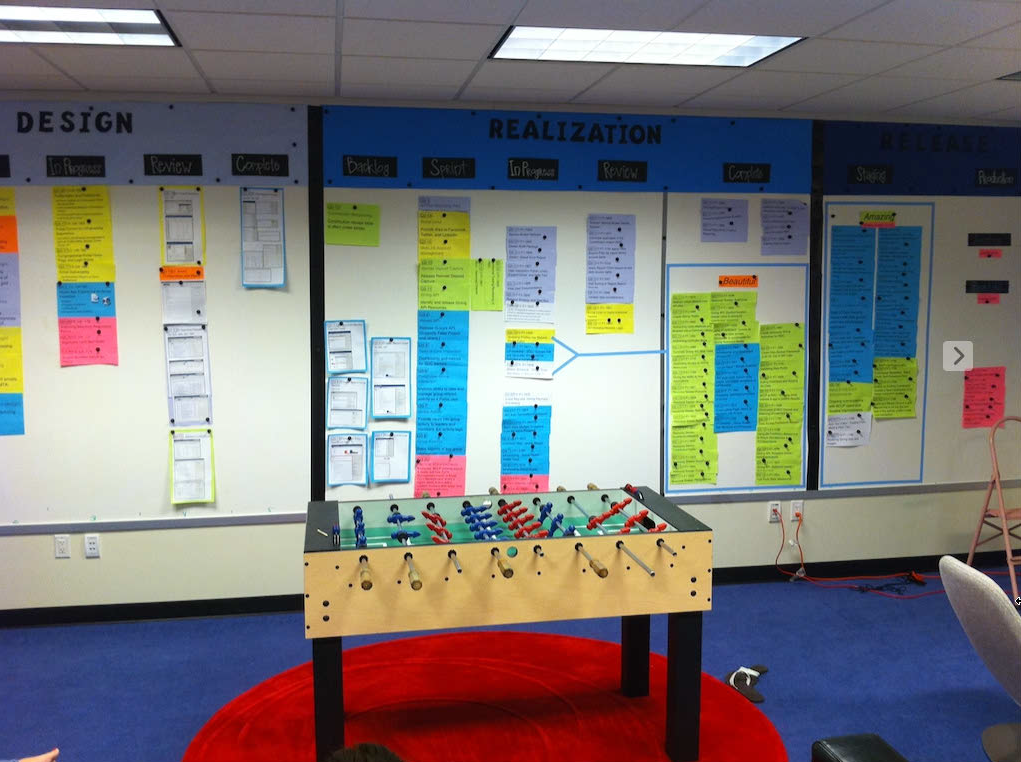
A Scrum Master pulled leaders from Product, Design, Engineering, QA, Marketing, and Ops into a 90-minute session, then mapped the flow from “opportunity discovered” to “customer adoption.”
Four queues that never appeared in Jira showed up on the wall: a two-week wait for legal language, an overloaded design handoff, an environment bottleneck, and a release gate that batched changes for “efficiency.”
Nothing inside the team had to change first; the system around the team did.
What.
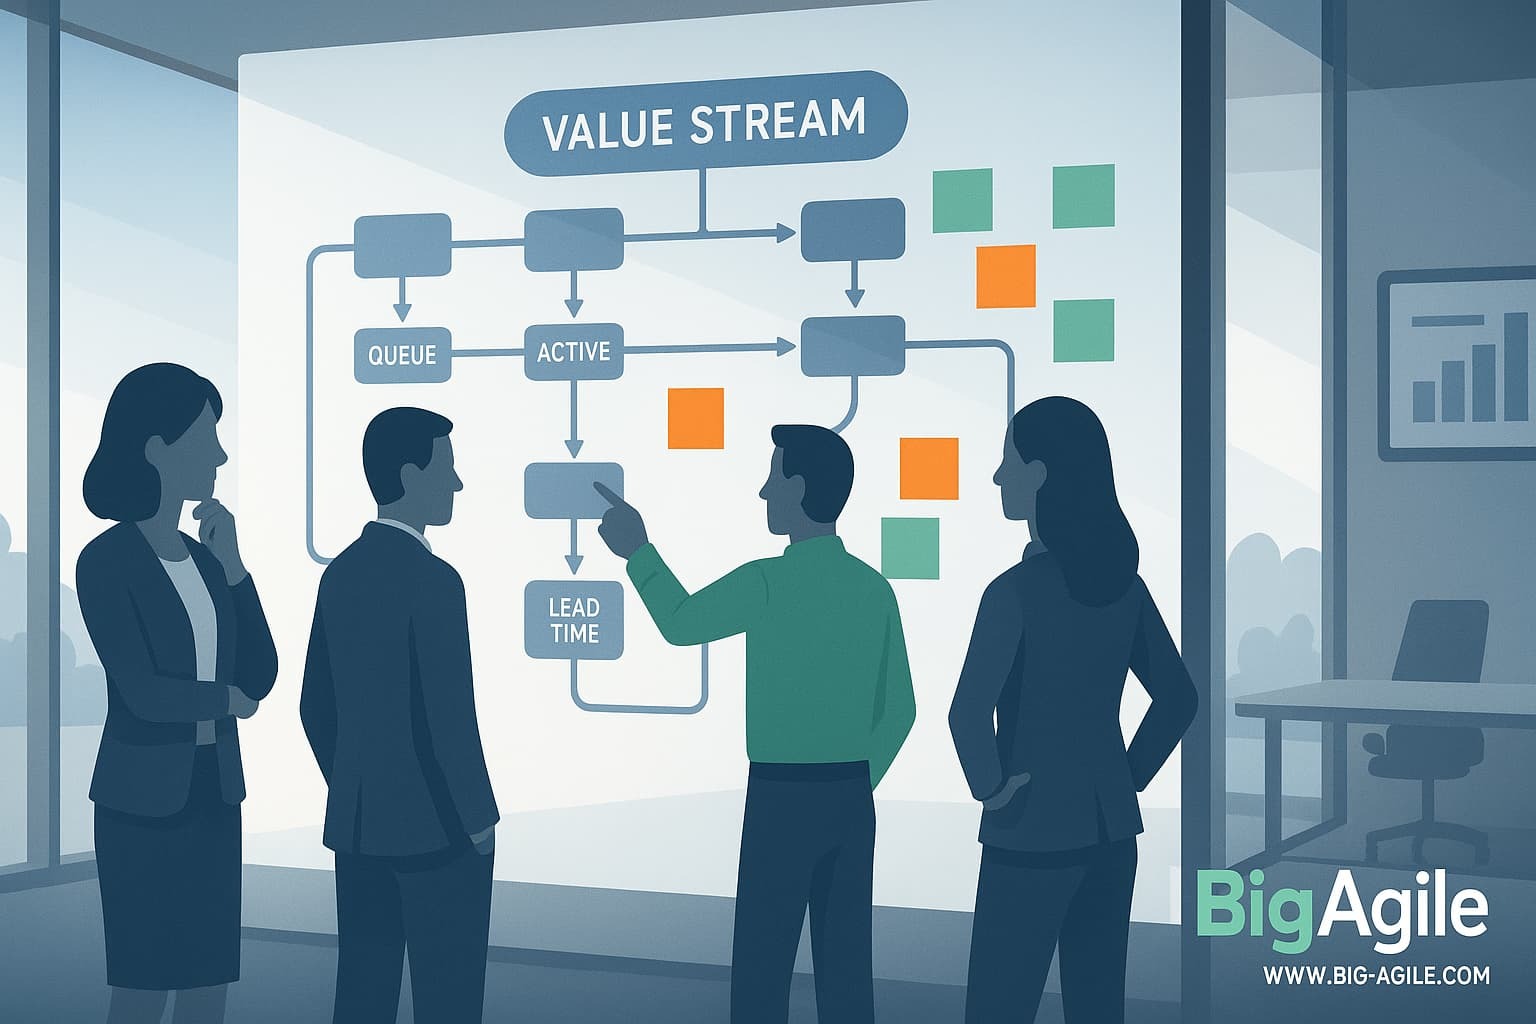
Value Stream Mapping is a way to see how ideas become impact; across discovery, build, release, and adoption. We draw each step, mark where work waits versus where work is touched, and name the entrance and exit criteria for the stream. We baseline a few Lean flow measures that matter to leaders and teams alike:
Lead Time (idea to customer impact)
Cycle Time (first touch to done)
WIP (how many items are in process)
Flow Efficiency (touch time divided by lead time)
Arrival Rate vs Throughput
Predictability.
We then connect the map to economics; calculations like the cost of delay help us quantify why shortening a specific queue is worth more than polishing a non-constraint.
So What?
When you optimize a single team, you often speed up the smallest part of the journey. The money is not in faster stand-ups; it is in fewer, shorter queues, approvals that take hours instead of weeks, a constraint that never starves, and a release policy that frees rather than cages. Without a system view, leaders chase velocity and celebrate ritual compliance; customers still wait, and teams still burn out.
With a system view, we can make one policy change and watch the lead time decrease; decisions become clearer because you are acting on the real levers, not just in metrics theater. Let’s also avoid focusing on sub-optimization; another pitfall in engineering leaders’ quest for performance. Optimize for delivery to the end user, not another team.
Now What?
Run a focused, 90-minute mapping session this week. Keep it lightweight, visual, and decisive.
Who to invite
Product, Design, Engineering, QA, a representative from any approval function (security, legal, compliance), Release or DevOps, and someone who owns customer adoption metrics. Your Scrum Master facilitates, your Product Leader anchors outcomes, and your Tech Lead grounds feasibility.
Materials
A big wall or virtual whiteboard, sticky notes in two colors (touch vs wait), a thick marker, and a visible timer.
Agenda
- 0–10 min, align scope: Agree on start (customer opportunity defined) and finish (measurable adoption or outcome). Pick one product or slice.
- 10–30 min, outline flow: Place each step from discovery to adoption. Label each handoff and approval.
- 30–55 min, quantify reality: For each step, estimate touch time and wait time from the last 10–20 items: Mark rework loops and blocked states.
- 55–70 min, find the constraint: Look for the longest queue or the station that starves downstream work. Circle it.
- 70–85 min, choose one experiment: Change one policy that shortens one queue, for one week. Examples: unbundle a legal review, pre-stage test data, dedicate a pairing hour at the constraint, and release smaller batches daily.
- 85–90 min, set measures and cadence: Capture Lead Time, Flow Efficiency, and Throughput baselines. Schedule a 15-minute weekly check using Process Behavior Charts so you react to signals, not noise.
How to measure without drama
- Track Lead Time for each completed item for the next two weeks; plot 20 points as soon as you can.
- Maintain an Events log; when you change a policy, name it on the day you change it.
- Use simple Process Behavior Charts (XmR) for Lead Time and Cycle Time; act only when you see a signal; a point outside limits, an 8-point shift, a clear trend.
Guardrails that keep this practical
- Do not boil the ocean; one stream, one queue, one experiment.
- Do not relabel steps to look better; capture how work actually happens.
- Do not hide approvals; if people wait for them, they are part of the stream.
- Do not add reports; replace the status theater with one visible map and three flow measures.
Let's Do This!
When everyone can see the same stream, the right decisions become obvious. You stop arguing about velocity and start shortening the path from idea to impact. Leaders get levers they can pull, teams get relief where it hurts, and customers feel progress sooner.
Map the work, name the constraint, make one change, then measure the difference; that is how you lead the stream.