DORA Metrics Deep Dive
Yesterday, we wired “Cycle-Time + PPC” alerts into Slack, proving that real-time flow data keeps teams honest about commitments. But executives still ask the same two questions: “How often can we ship?” and “How long does a change take?”
Those answers live in the four DORA metrics, especially:
- Deployment Frequency: How often do you deliver value
- Lead Time for Changes: Idea → production latency.
Today’s playbook shows how to pull those numbers straight from your Git provider, feed them into an LLM, and create a one-page narrative you can drop into any QBR deck, no data translator needed (hopefully). Keep in mind, these code examples might work for a team using them; but likely not plug and play for your own environment. My hope is, its enough detail that you can start experimenting with your tools.
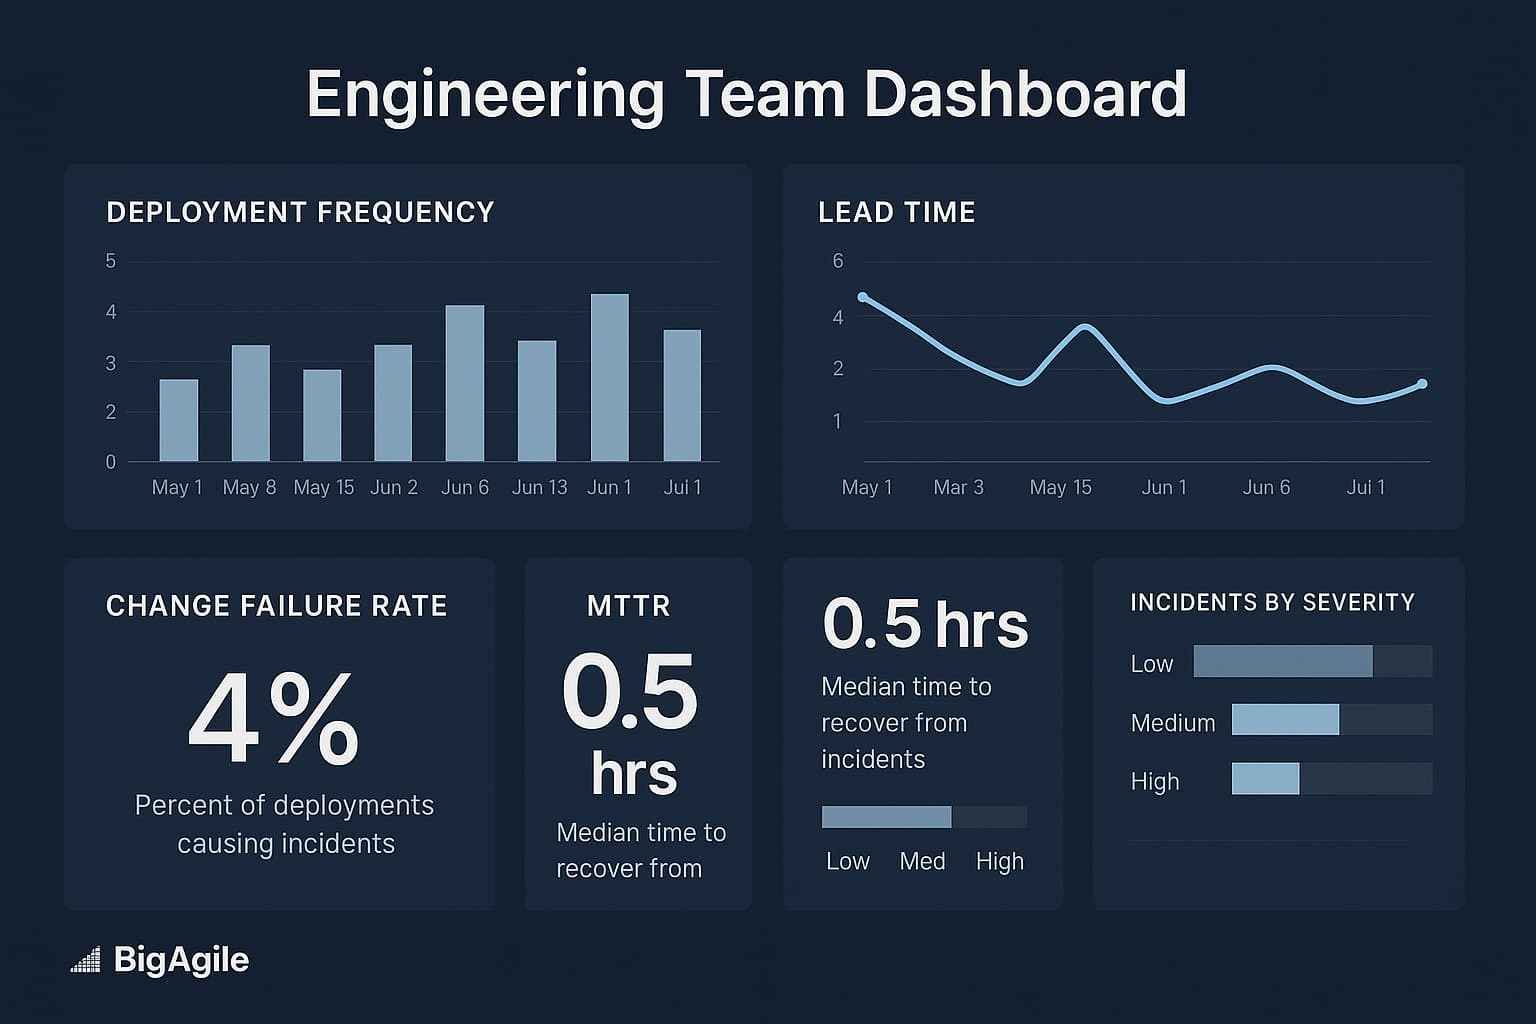
Collect, Deploy & Lead-Time Events
Before we can improve anything, we need clean, comparable timestamps. This step pulls release data and merged-request metadata directly from your Git provider’s API, providing you with the raw ingredients for the two DORA metrics that executives care about most: deployment frequency and lead time for changes.
Consider these API calls like a nightly blood draw for your delivery pipeline, you’re capturing its vital signs while the team sleeps. Once the JSON arrives in a file, you’re free from UI clicks or spreadsheet gymnastics, making every future analysis repeatable. Ensure your token permissions are set to read-only and store them in a secure variable so this script can run unattended.
# GitLab example (swap for GitHub Actions API as needed)
curl -H "PRIVATE-TOKEN:${GITLAB_TOKEN}" \
"https://gitlab.com/api/v4/projects/123/releases" \
  > releases.json               # deployment stamps
curl -H "PRIVATE-TOKEN:${GITLAB_TOKEN}" \
"https://gitlab.com/api/v4/projects/123/merge_requests?state=merged" \
  > mrs.json                    # lead-time stamps
Crunch the DORA Numbers with Pandas
Raw timestamps aren’t valid until we transform them into meaningful figures. Pandas allows you to bucket deploys by week and calculate lead-time statistics in just a few lines, requiring no data warehouse. The result is a concise dataframe: one row per week with deploy counts, and a separate series of lead-time percentiles. These figures establish your current baseline and reveal any significant spikes. Share the notebook, or the CSV export, with your DevOps engineer to validate the calculations, then freeze the calculation logic so future reruns remain consistent.
Ask the LLM for a Board-Friendly Narrative
Leaders don’t want scatterplots (even though they are essential and I like them); they want a story:
“Are we faster? Safer? More reliable?”
Feeding your freshly crunched metrics into an LLM transforms numbers into a concise, plain-English summary that anyone in the boardroom can understand. Our prompt adds business context, trend direction, percentile targets, and impact, so the model delivers an action-oriented slide note, not vague commentary.
import pandas as pd, json
from datetime import datetime
df_rel = pd.json_normalize(json.load(open('releases.json')))
df_mr  = pd.json_normalize(json.load(open('mrs.json')))
# Deployment Frequency (per week)
df_rel['released_at'] = pd.to_datetime(df_rel['released_at'])
deploys_per_week = (
    df_rel.groupby(df_rel['released_at'].dt.to_period('W')).size()
    .rename('deploys').reset_index()
)
# Lead Time for Changes
df_mr['created_at'] = pd.to_datetime(df_mr['created_at'])
df_mr['merged_at']  = pd.to_datetime(df_mr['merged_at'])
df_mr['lead_time_days'] = (df_mr['merged_at'] - df_mr['created_at']).dt.days
lead_time_stats = df_mr['lead_time_days'].describe(percentiles=[0.5, 0.85, 0.95])
Encourage product leaders to review and tweak the prompt; the clearer your context, the sharper the narrative. This turns a weekly data dump into insights even your CFO can quote.
Sample Output the C-Suite Reads
This section illustrates " good ": one paragraph, three numbers, a clear result, and a single next step.
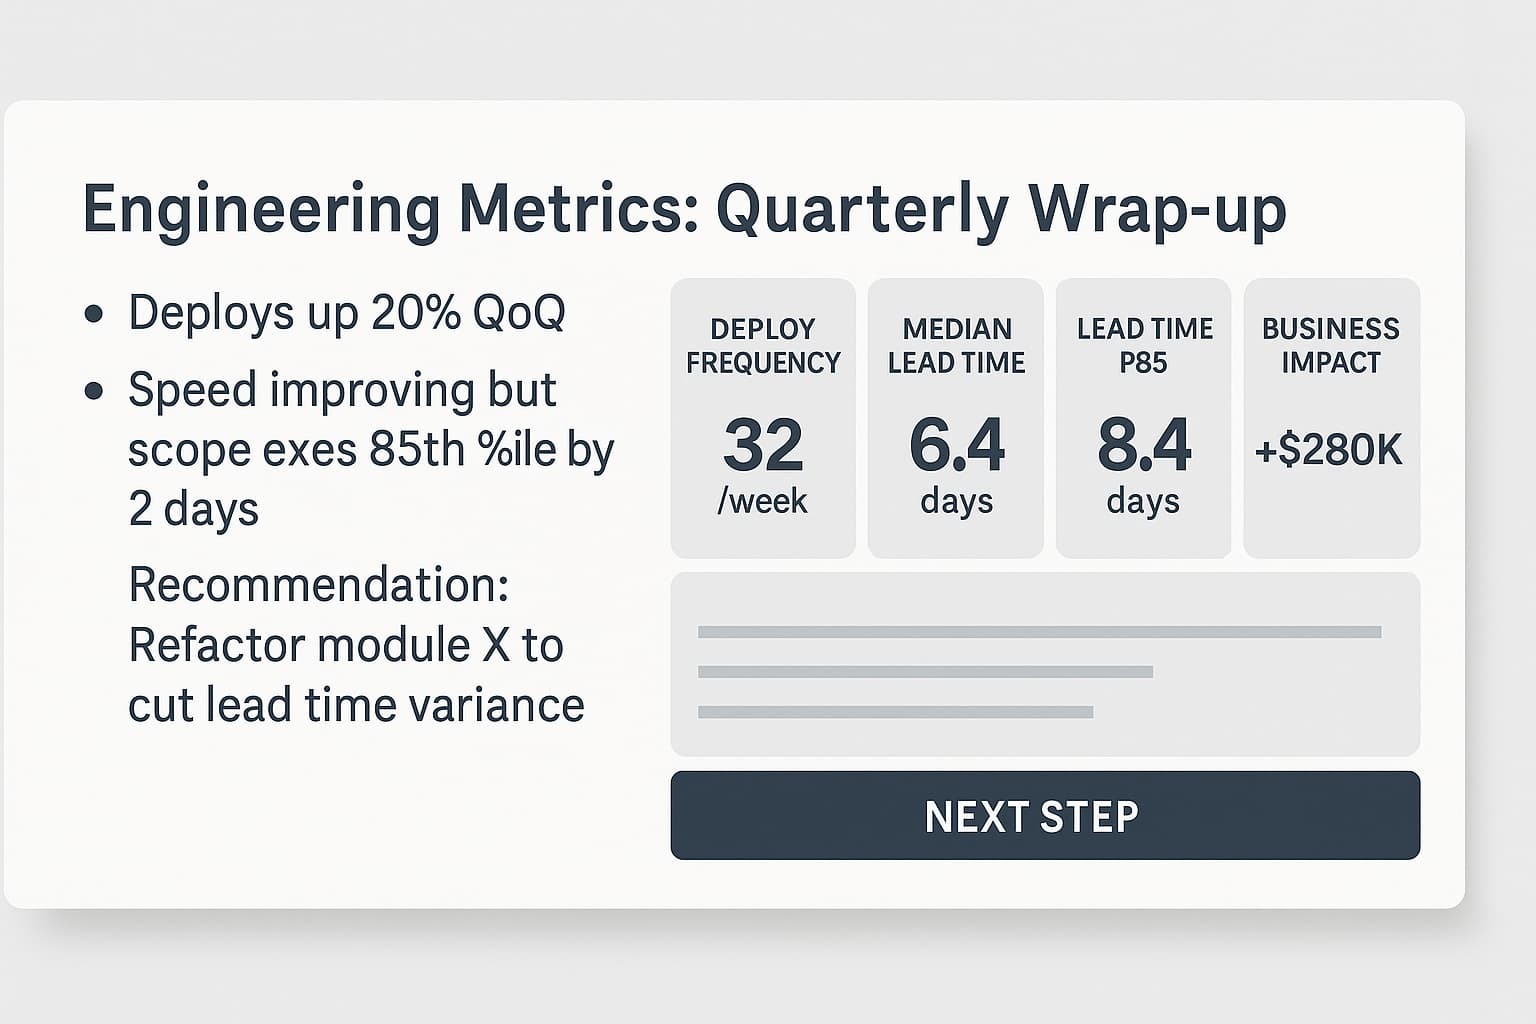
Placing that sample next to your output allows stakeholders to see precisely where your pipeline stands concerning best practices. Encourage teams to pin the narrative at the top of the sprint review deck, ensuring it cannot be overlooked. When leadership observes the delta between quarters decrease, they will support further automation efforts without hesitation.
from openai import OpenAI
client = OpenAI(api_key="YOUR_KEY")
prompt = f"""
You are a CTO ghost-writer. Summarize our last 12 weeks of DORA metrics.
Deploy frequency by week:
{deploys_per_week.tail(12).to_json(orient='records')}
Lead-time stats (days):
{lead_time_stats.to_json()}
Return a concise slide-note with:
• key trend (frequency up/down)
• lead-time percentile (P50 & P85)
• business impact in plain English
• one recommended next action
"""
response = client.chat.completions.create(
    model="gpt-4o-mini",
    messages=[{"role": "user", "content": prompt}],
    temperature=0.2
)
narrative = response.choices[0].message.content
print(narrative)
Automate the Loop
Manual reports die after the first outage; automation keeps insights flowing even when you’re firefighting. Integrating the ETL, pandas crunch, LLM prompt, and Slack push into a single nightly job ensures fresh data without adding meeting overhead.
Assign explicit owners: DevOps for the pipeline, a data lead for prompt tweaks, and the Chief of Staff for quarterly exports, so hand-offs are clear. The loop becomes a lightweight governance layer: the right person gets paged if a step fails, and your metrics never go dark.
| Task | How Often | Owner |
|---|---|---|
| Re-run ETL script + pandas | Nightly | Dev Ops job |
| LLM narrative generation | Nightly | Same pipeline |
Post to #exec-metrics Slack | Nightly | Webhook |
| Quarterly deck export (PDF) | QBR eve | EA / Chief of Staff |
Troubleshooting Cheat-Sheet
In my experience, no automation survives first contact with reality; tokens expire, pipelines stall, and data skews. This quick table maps the most common symptoms to their root causes and immediate countermeasures. Please post it in your team wiki so new engineers don’t reinvent diagnostics from scratch.
| Symptom | Likely Cause | Quick Fix |
|---|---|---|
| Deploy frequency flat-lines | Manual approvals clogging pipeline | Add policy-as-code & auto-rollbacks |
| Lead-time median fine, P85 sky-high | A few giant PRs | Enforce branch-size limits + pair reviews |
| Narrative too vague | Prompt missing context | Feed percentile targets & last-quarter goals |
Review the cheat sheet during retros; add it if a recurring pain isn’t listed. Over time, this living document becomes your internal knowledge base for keeping DORA metrics accurate and actionable.
Let’s stop flooding our leadership with raw deploy logs. Feed the numbers to AI, ship a slide they read, and use the headroom to improve what matters: lead-time that delights customers and deployment frequency that keeps risk small.
Tomorrow we’ll tackle scaling those improvements across ten teams with an AI-aided Scrum-of-Scrums, see you then!
Update with All Flow Radar Blogs
Over four days, we turned static charts into a living Flow Radar:
Download the sample scripts, wire them into your backlog today (make them better BTW), and post your first cycle-time chart in Slack before tomorrow’s stand-up.
Then grab a seat in our AI for Scrum Master or AI for Product Owner micro-courses to turn those insights into automated coaching workflows.
Spots fill fast, hit the link, reserve your cohort, and show up with real data.