As Agile Coaches, we often encounter (or I believe a majority of our encounters) are in the realms of organizational impediments. I have always liked to think of my job as an agile coach is very similar to a Zamboni for a hockey team.

My job is to help create and foster an environment for the team to thrive and perform their best. Similarly, the Zamboni resurfaces the ice periodically for the skaters so they can skate as fast and effective as they can (absent divots and cracks in the ice).
There can be issues coming along the way in any profession, and taking a structured approach to find the actual root cause for those problems is important to save time and costs. For such a structured approach, one can design the possible paths to arrive at a conclusion. That is where Fishbone diagrams become a very useful and effective way of visualizing the problem causes. A fishbone diagram is also known as an Ishikawa diagram, Herringbone diagram, or a Cause and Effect diagram.
Fishbone Diagram: An Overview
What is a fishbone diagram?
People in many industries use a fishbone diagram to visualize a particular problem and find out the potential root cause for the problem. For example, root cause analysis of software defects in the IT industry. It is also popularly known as the Cause and Effect diagram. It visualizes possible causes of the identified problems, enabling people to dig through a particular problem and resolve the root cause rather than trying to mitigate the signs of the problem.
Who invented the fishbone diagram?
The fishbone diagram had been in place since 1920. However, a Japanese quality control statistician, Dr. Kaoru Ishikawa, popularized it. It first became famous in the 1960s as the Ishikawa diagram. The popular use of this diagram is in six sigma’s DMAIC problem-solving approach. The DMAIC approach uses the fishbone diagram in its Analysis phase. It is now being used in many use cases and scenarios, including quality control and engineering designs.
When to use a fishbone diagram?
Even though the original use of the fishbone diagram is as a problem-solving approach, different uses make it an ideal tool for many fields. It is adaptable to many processes and systems, including manufacturing which allows creating a hierarchical system breaking down the contributing factors of the process or the system.
Following are the possible use cases for the fishbone diagram:
- Brainstorming for root cause analysis
- To analyze a problem statement
- To analyze a new design
- Process improvement
- Quality improvement
Fishbone Diagram Parts and How to Use Them
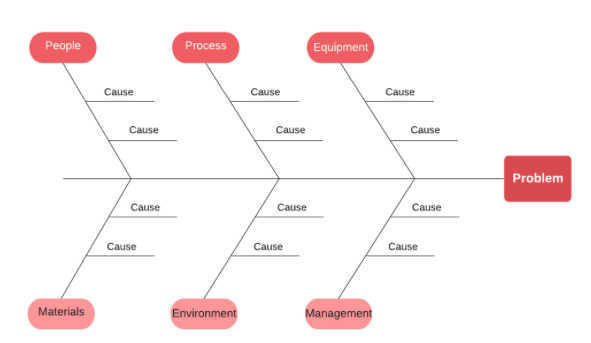
When you draw a fishbone diagram, it mimics a fish skeleton where you place the problem in the fish’s head, which faces the right side of the diagram, and the skeleton bones spread to the left represent its possible causes. The collection of these causes simulates the fish bones. Ribs represent the main causes of the problem, and the sub-branches that spread out from causes represent root causes. Depending on the number of possible causes, there can be many levels or branches for the fishbone diagram.
The following are the fishbone diagram parts which are related to the general steps you must follow when creating a fishbone diagram for your problems.
1. The head of the fishbone - The problem definition
The first requirement in creating an Ishikawa diagram is having a clearly defined problem. Identify the exact problem you or your team is facing right now, and note down where and when it arose. Then, write down the defined problem statement inside a box on a whiteboard or a piece of paper. Next, draw a horizontal line to represent the spine of the fishbone, starting with the problem statement box. This line enables you to brainstorm ideas and connect them with the problem.
Some useful tips for problem definition are:
With the clearly defined problem, clearly define your end goal or objective of the problem as well.
Draw the problem on the right side of the diagram. Bones represent the impact of the causes. Thus, place the cause that has the biggest impact closer to the problem and so on.
2. Bones to the left - the major factors/areas related to the problem
In step two, identify the main areas related to the problem. It means brainstorming the main areas of concern that caused the problem at hand. These major factors can differ according to the industry type and any models. For example,
- For manufacturing-related problems, major factors can be equipment, materials, systems, external forces, people, etc.
- In a marketing-related problem, these categories can be the 4Ps of Marketing: Product, Place, Price, and Promotion.
- Also, you can utilize methods such as McKinsey 7S Framework categories: Strategy, Structure, Systems, Shared Values, Skills, Style, and Staff.
After you have clearly identified the major areas of possible causes, draw lines across the diagram for each major area labeling each.
3. Rib bones - possible causes for each area related to the problem
Step three involves identifying the causes for each major factor devised in the second step. This step starts the real brainstorming session that digs through each major area. You can then draw a shorter line for each identified cause and label each possible cause for each major factor. If you have identified possible sub-causes for them, you can further draw a branch protruding from the possible causes for each major factor. For example, the following are the identified possible causes for a manufacturing company's problem of ‘why strawberry jams became unsellable?”.
- Method - lack of QA processes, outdated specification
- Material - contaminated fruits, seasonality
- Measurement - lack of accountability, inefficient data collection
- Machine - Outdated machinery, incorrect temperature
- Manpower - lack of training, too many responsibilities
- Environment - distractions, tired employees
4. Diagram Analysis
After completing the third step, you will have a complete fishbone diagram depicting all the possible causes for the problem you have defined. Depending on the complexity of your problem, the diagram can be a longer or a shorter one which you could fit into one small piece of paper.
Nowadays, there are many tools and software that are used to easily draw fishbone diagrams. They provide templates from which you can generate an initial diagram and adjust it, adding your own points. From this point onwards, you have a clear idea of possible causes. Therefore, you can further investigate the problem and examine each cause using strategies like surveys and tests that help narrow down what actually contributes to your defined problem.
In the above example in step 3, the most possible cause for the problem can be a lack of good material such as contaminated fruits and the seasonality of fruits. However, if you have never drawn a diagram like this, the root cause you would have guessed or identified will be an incorrect one.
There are a few helpful tips you may need to consider when coming up with a fishbone diagram.
One is identifying the major categories of causes. You can formulate a team from each area of the problem so that you can easily list down and investigate the possible causes and sub-causes related to each category.
Also, when deriving the root cause, take the vote of each team member to first shortlist the three possible causes. If you do so, you can easily narrow down all the causes and come at the right root cause at the end of the analysis phase. In addition, when listing the possible causes on a whiteboard, it is useful to use sticky notes as labels.
A software industry case study of Fishbone diagram
To show how a fishbone diagram is used in the software industry, we will explore a problem associated with a software product.
Suppose there is an e-learning software where instructors can create assignments for courses and students can register for courses and do assignments online. The e-learning platform consists of a Learning Management System (LMS) and a Subscription Management System (SMS) for subscribing to the courses offered in the LMS. During the first five years since the product's launch, student registrations for courses were steady.
However, suppose the product managers see a gradual decrease in user enrollments for the courses. This implies that the students do not see an actual benefit of doing online assessments for the courses they pay for. However, the real root cause for the problem might be completely different. To understand how we can find out the exact root cause for this problem, we will draw a fishbone diagram step by step from the beginning.
1. Problem Definition
As the first thing is defining the problem, it is best to be specific about what you will address. When exploring the problem, suppose there is a 20% decrease in student registrations through the subscription management system. There is a high volume of support calls during the registration peak hours. Therefore, the more specific definition for the problem would be “why is there a 20% decrease in student registration for the online learning system?”.
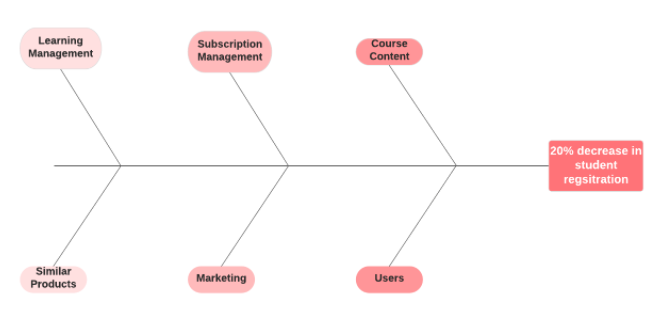
It is also important to note when and where it occurred when defining the problem. For example, during which days were user registrations lower, and support calls were higher? When you define the problem clearly, it is easy to identify the areas of the major causes. The following diagram shows the start of the fishbone diagram for the problem of “why is there a 20% decrease in student registration for the online learning system?”.

2. Identify the Major Factors
Next, identify the major factors that caused the decrease in student registration. Draw a straight line starting from the problem definition as depicted in the below diagram. For this example, the major factors for the identified problem can be the subscription management system, course content, Users, marketing, and the learning management system.
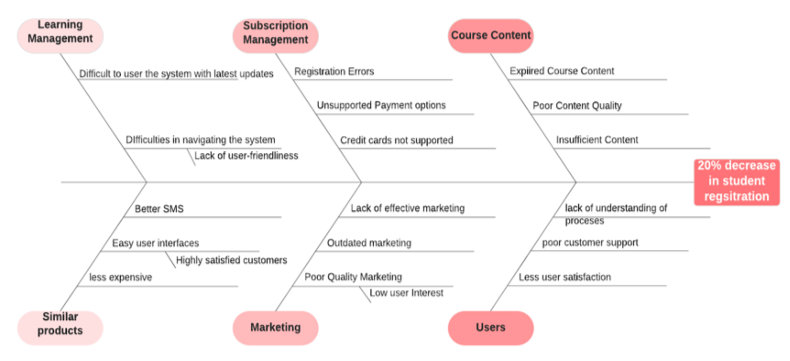
3. Identify the Possible Causes
Once you have identified the major problem areas, identify possible causes for each major category. For example, let’s take the area of course content where the course materials students get covered in the e-learning system. Following are the possible causes for investigation:
Course Content
- Expired course content
- Poor content quality
- Not enough content for the subject areas
When considering the Subscription management system, the possible causes can be:
- Registration errors
- Some credit cards are not covered
- The payment option is not supported
- Lack of guides on how to use the registration system
- Lack of auto-renewal
- System updates
When considering Marketing, the possible causes can be:
- Lack of effective marketing strategy
- Outdated marketing techniques
- Poor quality in marketing
The possible causes coming from the Users can be:
- Lack of understanding on how to use the registration system
- Customer support is not responsive
- Lack of user satisfaction with the software
- Users feel that the courses are too expensive.
The possible causes coming from the Learning Management System:
- Users’ do not like the latest updates to the system
- Difficulties in navigating the system
- Security issues
There can be many other potential causes for this problem. Fill the diagram with all the possible causes you can identify expanding it further. Depending on the complexity of each area, some areas may have many possible causes including sub-branches, while others have only a few. The above diagram shows the complete fishbone diagram with all the possible causes identified for each major factor. If you are using a particular software to draw one, you can mark each major factor in a different color so that the visualization becomes more clear.
4. Analyze the diagram
In the analysis phase, you dig through each possible cause and find out the exact root cause by conducting tests and surveys. In our example, after analyzing the fishbone diagram, a lack of understanding of how to use the updated subscription management system was found to be the real root cause for the problem. It has caused students to give up on using the e-learning product and find easy and clutter-free similar products.
A fishbone diagram does not directly show you the solution for the identified root cause. Rather, you may require separate tools and methods like process maps and brainstorming to develop the best possible solution for the root cause.
Conclusion
If you face any issue in your business, the Fishbone diagram helps identify the exact root cause for the problem out of all possible causes. Once you have identified the exact root cause, it is easy to come up with the right solution. Also, the fishbone diagram helps to visualize and understand the whole problem. Therefore, always try to prepare a fishbone diagram for any problem along your path to resolving problems quickly and easily.
We discuss this diagram and others in our Advanced Certified ScrumMaster Workshop.