
A delivery metric on its own is a target to game, and it can't tell you when your team has become the exception. DORA's metrics guide says to track several metrics, some deliberately in tension, and the vendor DX's Core 4 framework builds the same idea on DORA's metrics. This guide covers DORA's delivery metrics in their current names, what experience and outcome signals add, how to read DORA's 2025 team archetypes beside them, and how to put a balanced set on one small board. It closes with the Balanced Signal Board, a starter template you can copy and fill in for one team.
DORA's delivery metrics, in their current names
DORA measures software delivery with 5 metrics in 2 groups: throughput (change lead time, deployment frequency, failed deployment recovery time) and instability (change fail rate, deployment rework rate). Those are the names and the grouping in DORA's software delivery performance metrics guide, which is DORA's guidance rather than a research finding.
In plain terms, the throughput metrics ask how long a change takes to reach production, how often you deploy, and how fast you recover when a deployment fails. The instability metrics ask how often a deployment fails and how often you deploy a fix nobody planned. DORA's own reports word two of the names differently, and its 2024 report calls the second group stability, so you'll meet more than one label for the same metrics; this guide uses the metrics guide's.
Rework rate became DORA's fifth delivery metric in 2024. DORA defines rework rate as the share of deployments that were unplanned and made because of a problem in production; its survey asks about deployments made to fix a user-facing bug. Two weeks ago I called that work the team paid for twice, in the guide that swaps activity counts off the AI ROI slide, which paired lead time with change failure rate so gaming one shows on the other. This board starts from that pair rather than re-teaching it.
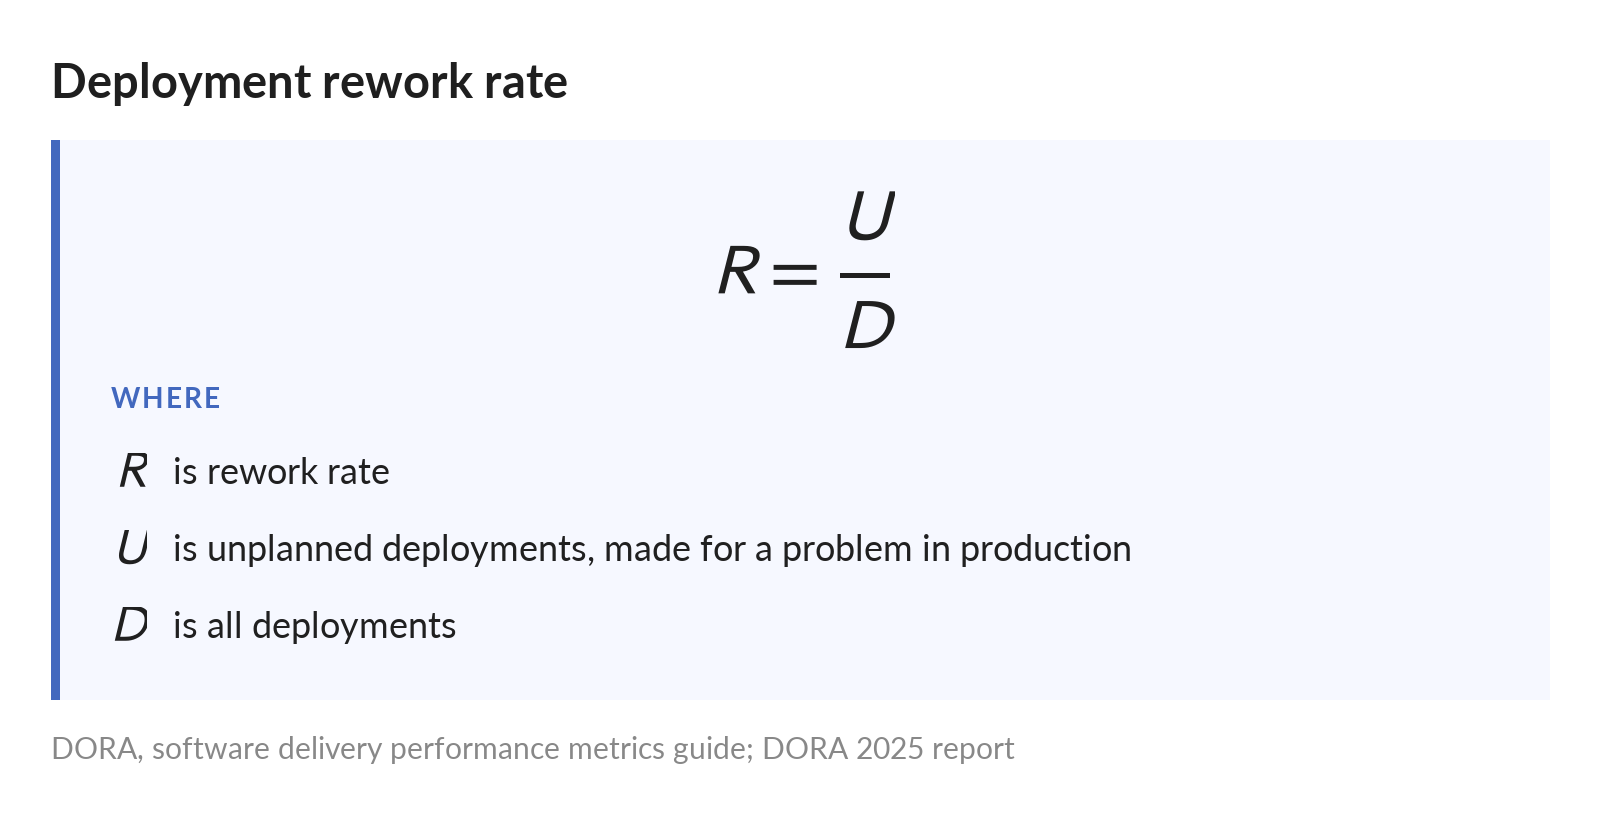
DORA's definition. Its survey asks about deployments made to fix a user-facing bug, so choose one count for your team and keep it.
If your team counts rework from its own pipeline, pick one of those two definitions and keep it. A deployment that fixes a production incident and one that fixes a user-facing bug aren't always the same deployment, and a count that drifts between them moves for reasons that have nothing to do with the work.
If your teams still benchmark against elite, DORA's own framing has moved. DORA's 2024 report still sorted teams into elite, high, medium and low clusters, and warned that improving matters more than the label; its current metrics guide uses no tiers. A board for one team compares that team with itself.
Why one delivery metric is a target to game
It would be easy to read a team that ships faster while its incidents climb as proof that speed costs stability. DORA reports that speed and stability are not tradeoffs: for most teams the delivery metrics are correlated. Its 2025 report calls the tradeoff a myth, with two of its clusters, nearly 40% of the sample, doing well on both. Those are associations among survey respondents, so they describe the population, not what happens when your team pushes on one number.
That's what makes a single number dangerous: it can't tell you when your team has become the exception. DORA's metrics guide warns against turning a metric into a goal, citing Goodhart's law, and against relying on one metric: teams should track several, some deliberately in tension with each other. Its example of a target to avoid is every application deploying multiple times a day by the end of the year. Big Agile covered Goodhart's law, in anthropologist Marilyn Strathern's 1997 wording, in the episode on reporting activity as return; what DORA adds is the remedy, several metrics with tension between them rather than a tighter target.
DORA has warned that a single AI-usage number, such as a token leaderboard, is easy to game, and recommends pairing its delivery metrics with efficiency and risk indicators. That post, from June, is DORA's guidance resting on press reports rather than a study, and it grants that token counts have uses. The point to take is the pairing, not a ban.
DORA also says its metrics work best for one application or service at a time, and warns against blending them across teams or using them to compete. Its unit is the service, not the team, so a team that owns several services builds its board for one of them.
DX Core 4 and DORA: not a versus
DX Core 4, published by the vendor DX in December 2024, measures developer productivity across four dimensions, speed, effectiveness, quality and business impact, which DX describes as counterbalanced because pushing one, such as speed, can hurt another. DX describes Core 4 as encapsulating DORA, SPACE and DevEx, built with authors of all three who are DX advisors. So Core 4 builds on DORA's metrics rather than competing with them, and it is not an independent second voice confirming DORA.
It does regroup one metric. DX's own Core 4 table, on its blog, files failed deployment recovery time under quality, where DORA files it under throughput. If a board mixes the two vocabularies, keep DORA's grouping for DORA's metrics.
Read Core 4 as a vendor's framework. DX sells developer-experience measurement, and DX is owned by Atlassian, which agreed to buy it in September 2025 and completed the purchase in November 2025. Its framework page reports results figures with no method or sample stated, so I don't use them.
Experience and outcome signals close the gaps
DORA's 2025 report says the five delivery metrics are outcomes: they show what is happening, not why, which is why DORA paired them with well-being and environment measures. Its example is a low deployment frequency that could come from technical debt, bureaucracy or burnout, which the metrics alone can't tell apart. In my experience those are three very different conversations with a team.
The principle is older than either DORA or DX, and two foundational sources argue it. Kaplan and Norton's balanced scorecard (Harvard Business Review, 1992) compared a company's measures to the dials in an airplane cockpit, where relying on one instrument can be fatal, and argued that viewing measures together shows when one area improves at another's expense. They wrote for executives running companies, so this board borrows their image, not their scorecard. The SPACE framework (Forsgren and colleagues, ACM Queue, 2021) holds that developer productivity cannot be reduced to one metric, and recommends metrics from at least three of its five dimensions, deliberately in tension.
DevEx (Noda, Storey, Forsgren and Greiler, ACM Queue, 2023) names three dimensions of developer experience, feedback loops, cognitive load and flow state, and says to measure developers' perceptions alongside system data. By the article's own author biographies, three of its four authors are DX's founder and CEO, chief scientist and head of research, so read it as written mainly by DX's founders and researchers.
So each row gets three kinds of signal. Delivery tells you what the system did. Experience tells you what it costs the people inside the system. And the outcome signal tells you whether a customer or the business noticed.
Keep the experience signal small: one question on a pulse survey each sprint, such as how much of your week went to work you didn't plan. For the outcome, pick something a person outside the team would notice, like support tickets, failed checkouts or a renewal call that went sideways. It doesn't need to be perfect; it needs to matter to a customer or the business.
DORA's 2024 report advises looking beyond the four keys: it rates user-feedback metrics as important as the four keys and recommends dashboards that combine technical and business metrics. The same page holds that collecting more metrics supports better decisions, and that is where I part ways with it. SPACE itself warns that too many metrics confuse and demotivate.
Reading DORA's 2025 team archetypes beside the delivery metrics
DORA's 2025 report sorts survey respondents into 7 team archetypes, from a cluster analysis that combines delivery metrics with well-being and outcome measures: Foundational challenges, The legacy bottleneck, Constrained by process, High impact low cadence, Stable and methodical, Pragmatic performers, Harmonious high-achievers. That's DORA doing at survey scale what the board does for one team: reading delivery beside how people experience the work and what the work produces.
Two cautions before you use them. The names are DORA's interpretation of respondent clusters, so "we're Pragmatic performers" is a self-diagnosis, not a DORA classification of your team. And the shares DORA reports, from 7% to 20% of respondents per cluster, are shares of 2025 survey respondents, not of teams.
Where they help is as a mirror. Read the descriptions with your team and ask which one you'd argue with, and which of your delivery numbers would look different read beside that description. An archetype is a prompt for a conversation, not a grade.
The Balanced Signal Board
Every delivery metric on the board gets two neighbors: an experience signal and an outcome signal. Keep the delivery metric that checks it on the same row, the way rework rate sits beside lead time. Every row carries one note, answered in advance: if somebody games this number, which axis moves? "Nowhere yet" is a valid answer, because it tells you where the board may be blind.
The board won't stop anyone from gaming a number, but it gives the game somewhere to show up. These pairings are Big Agile's practice, a starting point and not a standard, and DORA doesn't prescribe this board. Adjust them to your team's work, and don't use the board to grade a team.
BALANCED SIGNAL BOARD
One team, one service. One row per delivery metric.
Read every row together, every week.
TEAM AND SERVICE: ______________________________
DELIVERY
  The metric the team is praised for.
  ______________________________________________
CHECKED BY
  The delivery metric that argues with it, on the
  same row: rework rate beside lead time.
  ______________________________________________
EXPERIENCE
  What this number costs the people producing
  it. One pulse question each sprint is enough.
  ______________________________________________
OUTCOME
  What a customer or the business would notice
  if this number went wrong.
  ______________________________________________
IF GAMED
  If somebody games this number, which axis moves?
  Answer before anyone can. "Nowhere yet" counts.
  ______________________________________________
LAST DECISION
  The decision this row changed, and when.
  ______________________________________________
NEXT ROWS: the same six lines. Add a row only
when the team can name a decision it would
change.
DONE WHEN: every row has all six lines, the team
has read the rows together weekly for a month,
and any row that changed no decision is gone.
ILLUSTRATIVE ROW ONE. FICTIONAL.
DELIVERY Change lead time. Fell sharply
this quarter and got its own slide.
CHECKED BY Rework rate. Climbing: more deploys
are unplanned fixes for production.
EXPERIENCE Pulse question: "How much of your
week went to work you didn't plan?"
Most of the team: "most of it."
OUTCOME Support tickets on checkout.
IF GAMED Ship half-finished work to cut lead
time: rework rate moves first, then
the pulse survey.
LAST DECISION Hold new work one sprint and find
why fixes ship unplanned.ILLUSTRATIVE ROW TWO. FICTIONAL.
DELIVERY Deployment frequency.
CHECKED BY Change fail rate.
EXPERIENCE After-hours calls to whoever is
on call.
OUTCOME Incidents a customer found before
the team did.
IF GAMED Slice changes into slivers to
raise the count: nowhere yet. The
board is blind here; write it down.
LAST DECISION Look for a change-size signal
before the next review.Keep it small. If a signal on the board never changes a decision, take it off, which is the same test as auditing dashboards by the decisions they change. A board nobody acts on is just a nicer-looking report.
Try this next week: build one row for one team
Pick one team and one service. Find the number that team gets praised for, the one that earns a slide, and ask two questions about it: what does this number cost the people producing it, and who outside the team would notice if it went wrong? Write one signal for each answer. That's your first row, and its note is the next thing to write.
Start with DORA's Quick Check, which gives a team a baseline: an overall delivery score on a 0 to 10 scale built from the five metrics, separate throughput and stability scores, and benchmarks from DORA's 2025 research. DORA recommends running it for one application, with its cross-functional team discussing each answer. The answers are self-reported multiple choice, and the overall score is a summary to read with its parts beside it, not a number to set as a target.
Then read all three signals together every week for a month. When they disagree, don't pick the one you like; the disagreement is the conversation, so take it to a retrospective. A month of weekly reads also teaches you which movements are noise and which are a real change. If the first look at all three together is uncomfortable, the board is working.
If you're setting this up across several teams, it's the kind of measurement work we do in coaching engagements. Steer with one gauge and you'll drive straight into the thing it doesn't show.
Building your first row and want a second set of eyes on it? Send me a note if you need help.