
Monday's episode asked where the speed from AI coding tools goes when less of it reaches the customer than reaches the keyboard. This guide picks up there: how the line forms in front of review, how to find it in your own repo, and how to put a limit on it.
How a queue forms when writing outpaces review
Picture your delivery system as a pipe to production. Writing code is the front of the pipe, review sits in the middle, and deployment is the far end. AI coding tools widened the front. Nobody widened the middle, so the extra pull requests (a pull request is a proposed change waiting for someone to review it and merge it into the shared code) don't flow any faster; they stack up in front of review.
That's the theory of constraints, from Eliyahu Goldratt's The Goal (1984), foundational rather than new research. A system moves at the pace of its constraint, the one station everything else ends up waiting on. Speed up a station that isn't the constraint and you don't get more out of the far end; you get a pile in front of the constraint. Throughput at one station isn't flow through the system, and the pile is inventory: work you've paid for that isn't delivering anything yet.
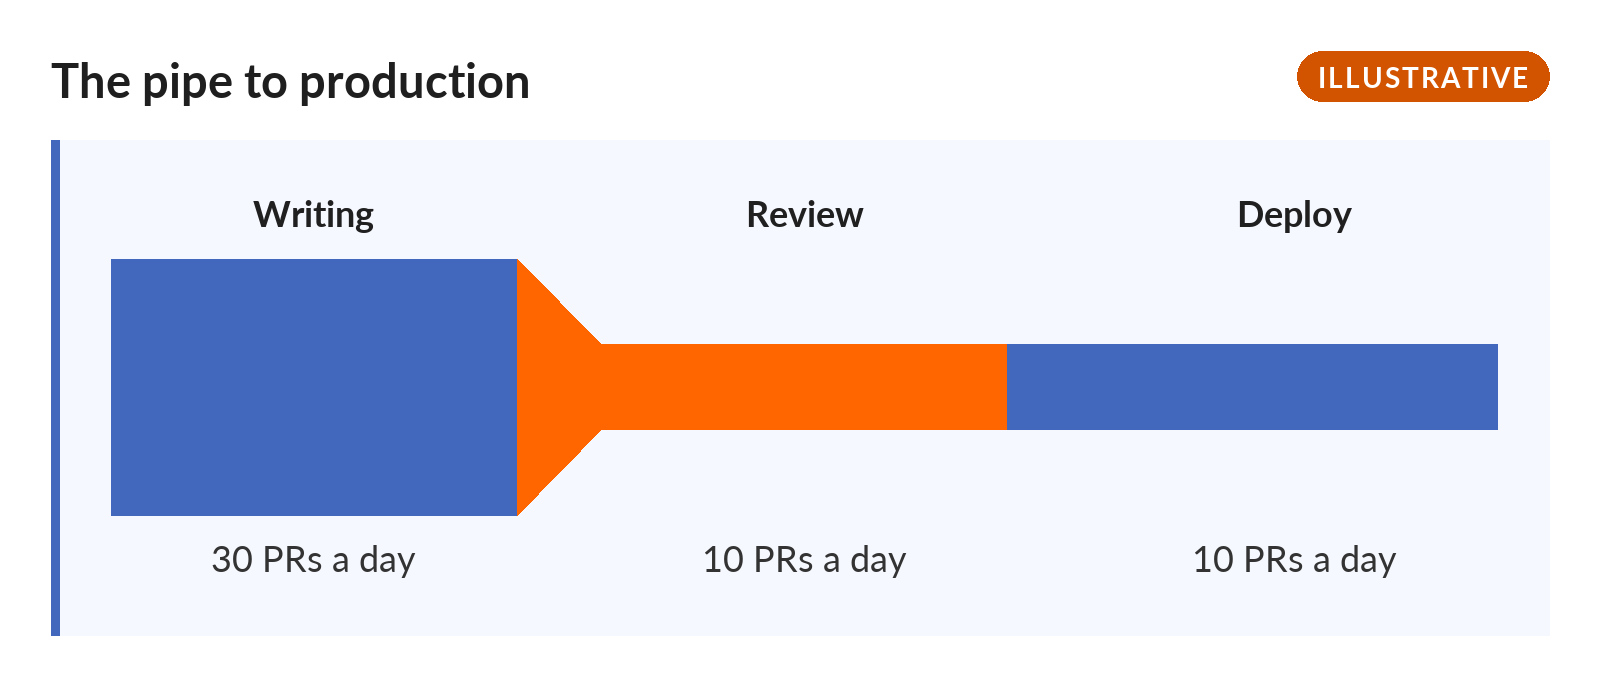
The arithmetic is one subtraction. Take the video's made-up team, illustrative from top to bottom: two reviewers who close 10 pu,ll requests a day between them. Before the AI tools the team opened 10 a day, so 10 went in, 10 came out, and the line held steady at 20 open. Now the team opens 30 a day.
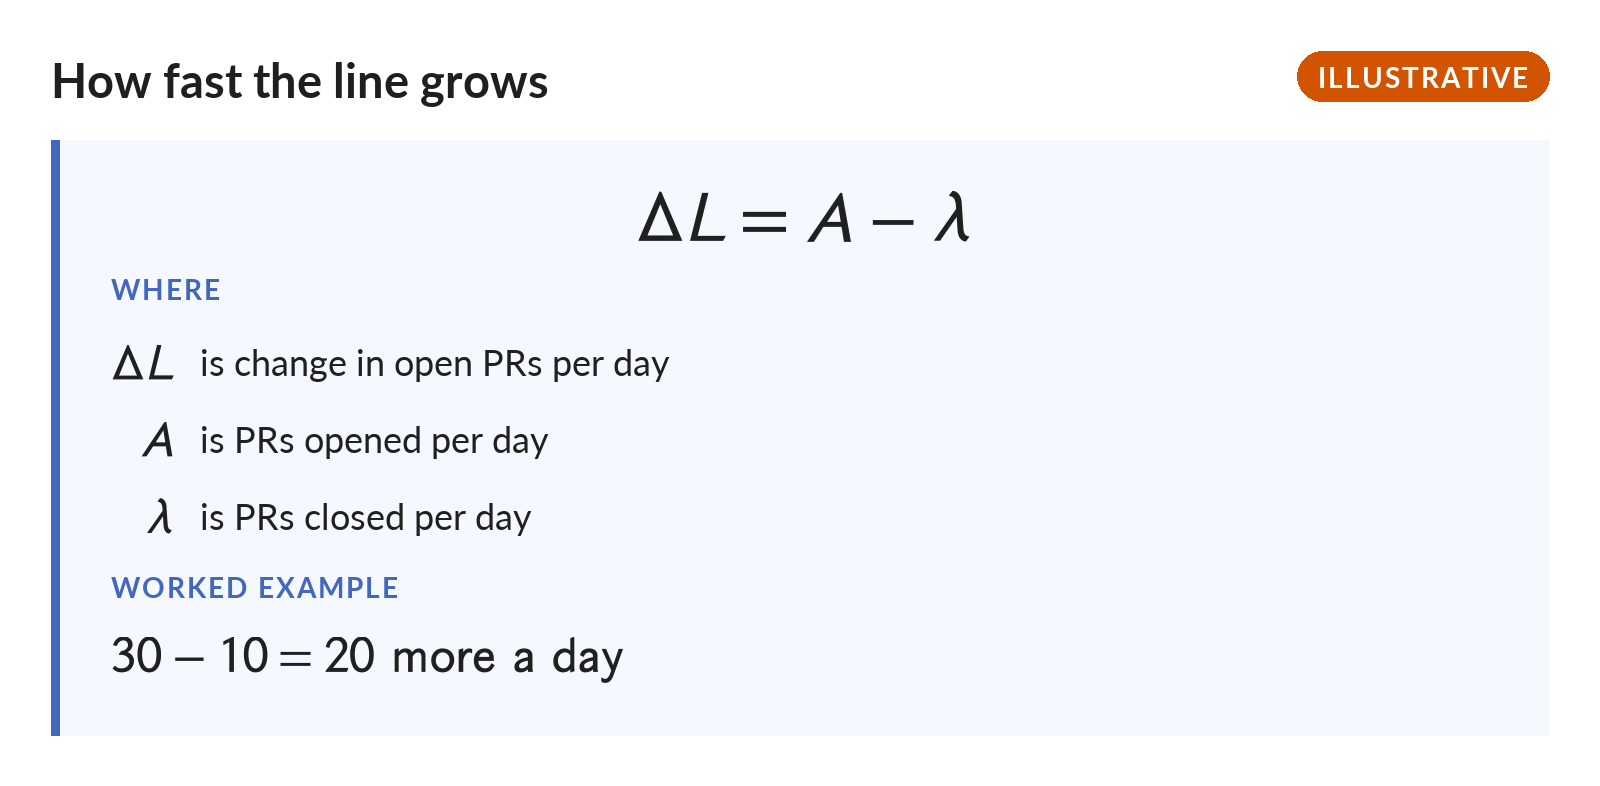
The change in open PRs per day equals PRs opened per day minus PRs closed per day. For the made-up team that's 30 minus 10, so 20 more pull requests join the line every day than leave it: a hundred more after a work week, and about four hundred after a month of workdays. Meanwhile the chart of pull requests opened just tripled, and nobody closed anything faster. The work got written; it didn't get delivered.
So where would I look for your constraint? Not where everyone looks busy. Look for the place where work isn't moving. When I've coached teams through this, the search keeps ending at branching and merging, the messy part of software development where many hands change one shared code base at once.
Read the two Opsera numbers as a pair
The clearest data I've found on this is vendor data. Opsera, which describes itself as "the unified DevOps platform that automates and secures software delivery," published its 2026 AI Coding Impact Benchmark Report from its product team's telemetry on more than 250,000 developers at more than 60 enterprise organizations, collected across 2025. A company that sells delivery automation has a stake in finding delivery friction, so I read the report as directional, not as a neutral audit. That stake doesn't make the findings false, and the fix in this guide isn't something anyone sells.
Start with the concession, because it's real. Opsera's own table reports deployment frequency up 39 to 49% against what it calls a pre-AI baseline, as a weighted enterprise average. So this isn't an argument that AI failed to speed anything up. It's an argument about how much of the speed reaches delivery.
Now the pair. In the same Opsera data, what it calls time to pull request improved 48 to 58% on average, and AI-generated pull requests waited 4.6 times longer than human-written ones to be picked up for review. Opsera places that wait mainly before the first review, and says review itself stretches out too without putting a number on it. One number is speed at the keyboard and the other is a wait at review, and neither means much without the other.
The report leaves gaps worth knowing about. The 4.6 compares two kinds of pull request inside one dataset, so it isn't a queue that grew over time, and Opsera doesn't say whether the wait runs in hours or days. Opsera also measures no lead time, how long a change takes to reach a customer, so the distance between keyboard speed and delivery can't be computed from these percentages. Its own reading is that "outer-loop friction neutralizes much of the benefit," where the outer loop is everything after the code is written (review, testing, deployment), and that's Opsera interpreting its data rather than measuring it.
If you read the verification-capacity guide from August, this is a different claim. That one was about how much checking a reviewer can do in a week. This one is about flow: a faster station upstream of a fixed one turns speed into inventory, whatever the reviewer is checking for.
Size the line with Little's Law
Little's Law is a foundational queueing result from 1961, not new research. For a line that's holding steady, it says the average number of items waiting equals the rate you finish them times how long each one stays. Written for a pull request queue, that's L = λW: L is open PRs, λ (lambda) is PRs closed per day, and W is the average days a PR stays open. In a steady line, PRs closed per day equals PRs arriving per day, which is what makes the equation hold.
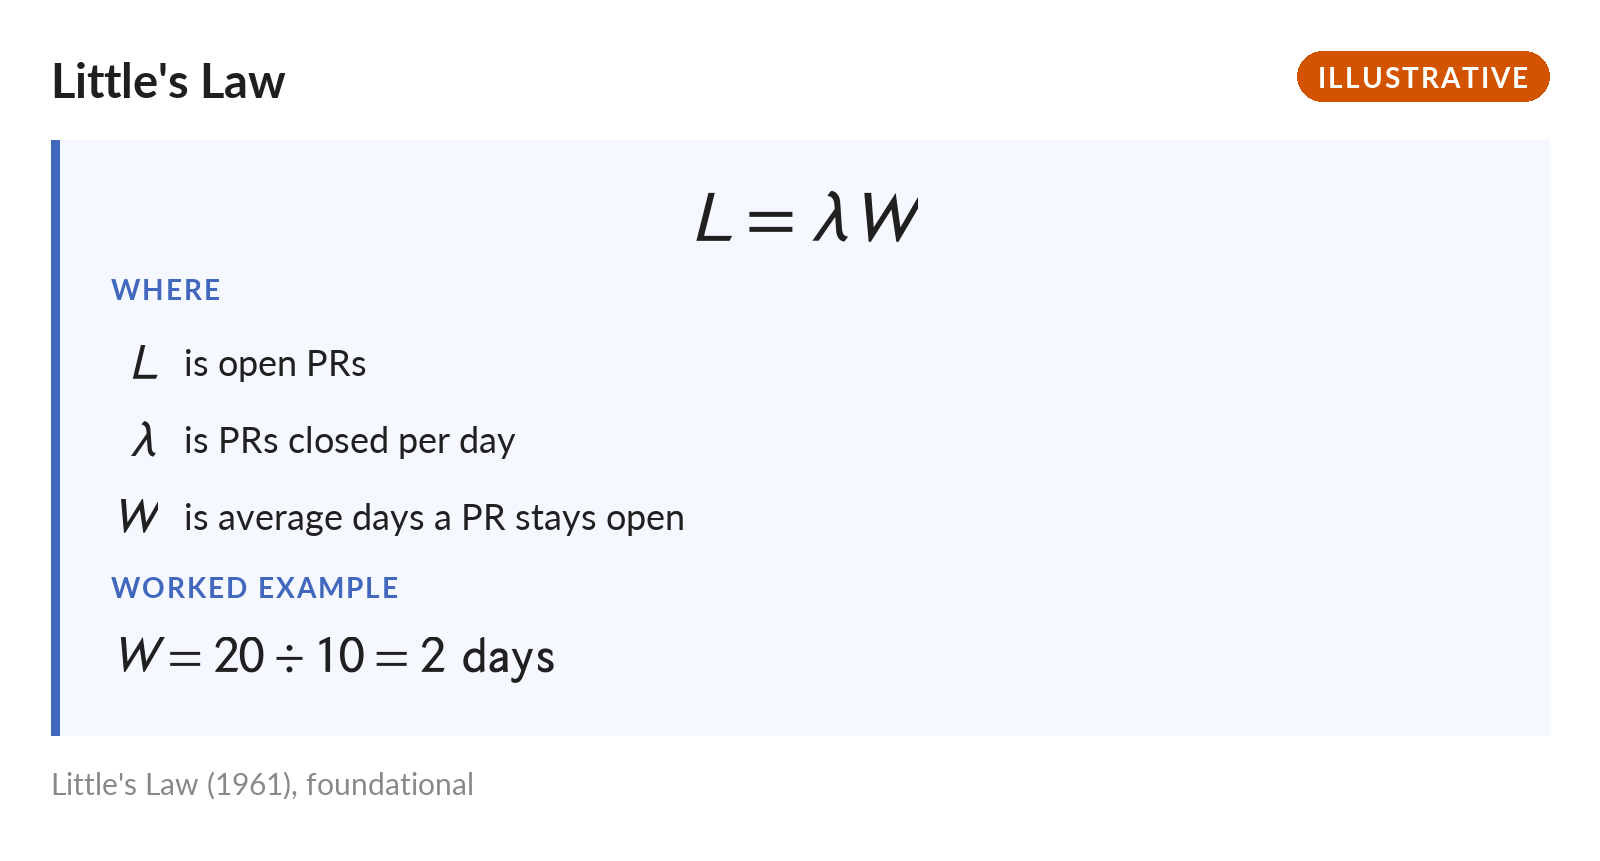
Flip it around and average days open equals open PRs ÷ PRs closed per day. For the made-up team before the AI tools, 20 open ÷ 10 closed a day is 2 days, on average, from opening a pull request to closing it. That's time open with review included. It isn't Opsera's wait before first review, and the two numbers don't belong in the same comparison.
The formula has one condition, and the made-up team broke it the day the tools arrived. Little's Law only gives you an average while the open count is holding steady. With 30 arriving and 10 leaving, the line never settles at a new, longer time open; it keeps growing until something changes. A steady line is the healthy state, and a growing one is the problem you're trying to see.
Think of a sink with the faucet wide open and the drain the same size it always was. The water doesn't find a new resting level. It rises until somebody turns the faucet down or opens the drain.
Put a limit on the line
Work in progress, or WIP, is everything started and not yet finished, and a WIP limit caps how much of it you allow at once. Say the team caps open pull requests at 20. When the line hits 20, nobody opens a new one; they review one instead. No manager has to walk in and move people around, because the limit shows the team where the help is needed.
This is where software bends the factory picture in your favor. A machine on a plant floor can't walk over and do the next machine's job while it waits. In the teams I coach, the people who review code are the same people who write it, so review capacity isn't fixed by physics. It's fixed by how the team chooses to spend its hours, and that's a choice the team can change next week.
Say that moves the made-up team from 10 closed a day to 20. Now 20 go in and 20 come out, the line holds steady, and Little's Law works again. With the cap held full, average days open equals the cap ÷ PRs closed per day: 20 ÷ 20 is 1 day, down from 2, with the same people and the same tools.
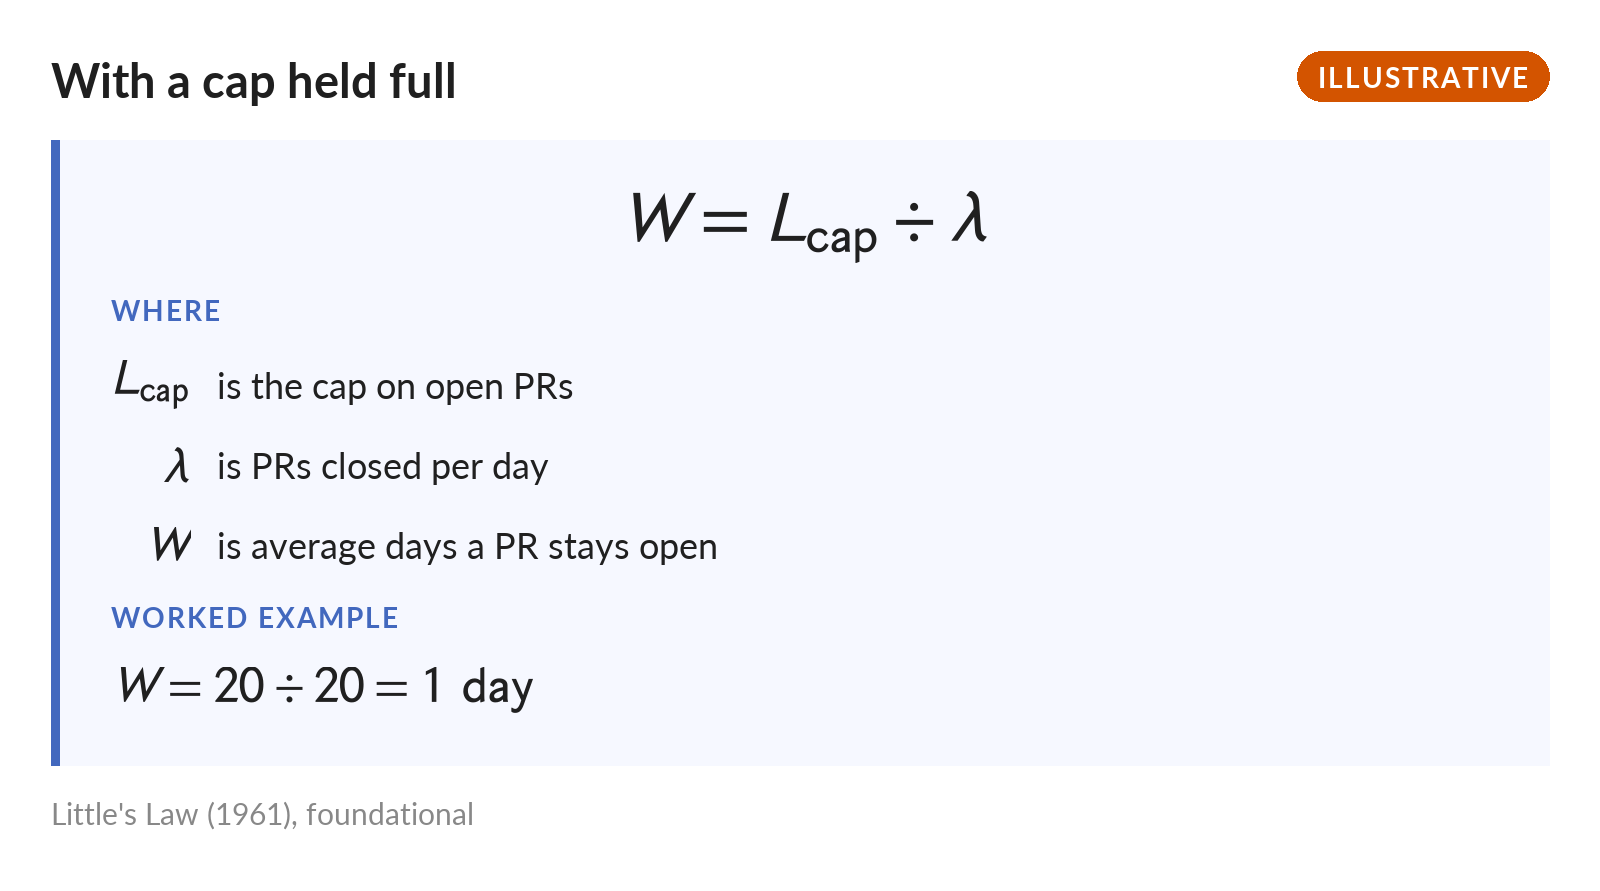
Average days open equals the cap divided by PRs closed per day. Illustrative: a cap of 20, with review closing 20 a day.
Look at what reaches delivery now: 20 a day, where it was 10 before the tools. The speed reached the customer because somebody worked the constraint, and it came from writing less than the team could and reviewing twice as much. That feels backwards when the dashboard rewards writing, which is exactly why it's worth doing on purpose.
The Queue Locator
The Queue Locator is a free worksheet for doing this on your own repo. It starts with one question, where did we add speed, then asks which station absorbed it, and scores whether your review work in progress has a limit. Fill it in with the people who write and review the code, since they're the ones who can change the answer.
THE QUEUE LOCATOR
One repo, one team. Fill it in with the people who
write and review the code.
WHERE DID WE ADD SPEED?
  Name the change: a tool, a hire, a new process.
  Which station does it make faster?
  Answer: ____________________________________
WHICH STATION ABSORBED IT?
  Count the PRs waiting on a first review today.
  Count them again seven days later.
  Today: ________   Seven days later: ________
  A climbing count means work arrives faster
  than review closes it. That is the station.
  Station: ___________________________________
SIZE THE LINE, ONLY IF THE COUNT HELD STEADY
  Open PRs today:                ________
  PRs closed per day:            ________
  Average days open = open PRs ÷ PRs closed
    per day, review included:    ________
  If the count climbed, skip this step. A
  growing line has no steady average.
SCORE YOUR REVIEW LIMIT. Circle one.
  NONE     No cap. Anyone opens a PR any time.
  PAPER    A cap exists. Nobody stops at it.
  WORKING  A cap exists. At the cap, writers
           review instead of opening new work.
  Score: ____________
DONE WHEN: one station is named, the count is
taken twice, and the score is WORKING, or the
team has picked the day it will try a cap.
ILLUSTRATIVE EXAMPLE. THE VIDEO'S MADE-UP TEAM.
SPEED ADDED AI coding tools. Writing went from
10 PRs a day to 30.
STATION Review. The waiting count grew by
20 a day, a hundred more in one
work week.
SIZE Skipped. The count climbed.
LIMIT NONE. After a cap of 20, where
writers review at the cap: WORKING.
Review closes 20 a day, and average
days open is 20 ÷ 20 = 1 day.Try this next week
Open your busiest repo and count the pull requests waiting on a first review. That one number is your line, or the best first read of it. Count again a week later. If it's climbing, work is arriving faster than your team reviews it, and the Queue Locator's sizing step has to wait until a limit brings the line back to steady.
If you run the organization, change the slide. Put pull requests waiting for a first review right next to pull requests opened, so the speed and the line show up together. When both climb at once, that's your constraint talking. A metric that changes no decision is overhead, and this pair changes a real one: whether the team writes or reviews this afternoon.
A count of pull requests opened tells you about the front of the pipe and nothing about the far end, which is the case for measuring flow rather than output. When I coach a team through its first WIP limit, the hard part is the first afternoon the line is full and nobody's allowed to start something new. That afternoon is what our coaching work is built around.
So count it. Is your line climbing, or holding?
You can't out-type the constraint.