
Flow+Joy Focus.
Reduce cognitive load so teams focus on features; insights from the DZone Developer-Experience Trend Report on Platform Engineering. Self-serve platform services cut environment setup time in half, freeing developers to write features instead of wrestling with YAML. That sounds like Flow + Joy to me, let's dive in!
People → Service → Profit.
High-cognitive-load chores (i.e., spinning up a test database, begging for IAM rights) bleed developer energy. A paved-road platform removes that mental drag; engineers stay in the flow, and quality climbs. Faster, calmer delivery delights customers, lowering churn and pushing profit upward without adding headcount. Remember (well, you probably don’t), I have always said agile is not about faster, it’s about better. The better transforms into more efficient teams, making us faster. Quick and easy...that is our motto (that will usually translate to faster for the people who want it.
Why It Matters
- 3% of respondents in DZone’s report rank “environment friction” as their top daily blocker (meaning it's likely yours too).
- Long setup times delay feedback, inflating cycle time and eroding joy.
- Platform self-service brings repeatability; repeatability breeds predictability; predictability earns stakeholder trust.
5-Step Implementation
Step 1 – Collect Environment-Setup Logs
You can’t improve what you don’t time-stamp. Start by exporting the build-pipeline job that provisions dev, QA, and staging environments.
# Azure DevOps example az pipelines runs list --pipeline-id 22 --query "[?result=='succeeded']" \ --output json > env_runs.json Step 2 – Normalize & Tag
Parse the JSON and tag each run with team and environment so you can group by cognitive load hotspots.
import pandas as pd, json, re runs = pd.json_normalize(json.load(open('env_runs.json'))) runs['env'] = runs['name'].str.extract(r'(dev|qa|staging)') runs['team'] = runs['triggerInfo.sourceBranch'].str.extract(r'/teams/(\w+)') runs['setup_minutes'] = runs['durationInSec'] / 60 runs.to_csv('env_setup_sample.csv', index=False) Step 3 – Calculate Cognitive-Load Score
Average setup time × number of runs gives you a single pain index per team.
df = pd.read_csv('env_setup_sample.csv') pain = (df.groupby('team')['setup_minutes'] .agg(['mean','count']) .assign(cog_load=lambda x: x['mean']*x['count'])) pain.to_csv('cog_load.csv') Step 4 – Visualize Bottlenecks
A heat-map makes it obvious which squads drown in yak-shaving.
import matplotlib.pyplot as plt, seaborn as sns pivot = df.pivot_table(index='team', columns='env', values='setup_minutes', aggfunc='mean') sns.heatmap(pivot, annot=True, cmap='YlGnBu') plt.title('Avg Setup Minutes per Environment') plt.tight_layout(); plt.savefig('platform_cogload_heatmap.png')
Yak-shaving” is the whimsical term for every incidental chore you must finish before doing the real work, like having to request a database, wait for VPN access, then debug a broken Terraform module just to run a unit test. Each chore seems small, but the cumulative drag leaves little time for product features.
A vibrant heat-map visualizes that hidden drag; brighter squares mean less yak fur on the floor and more cognitive bandwidth for customer value. Use the chart to celebrate when a cell turns from indigo to lime, because that’s one less yak shaved and one happier developer.
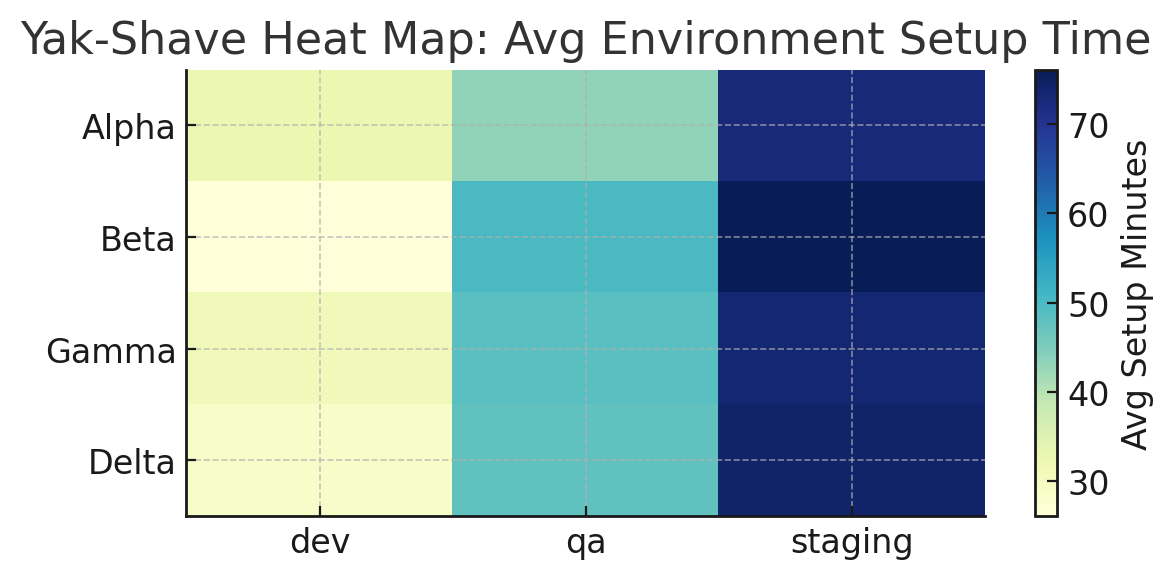
How to Read & Present the Heat Map
- Axes & Colors: Each row is a team; each column is an environment. The color scale runs from light yellow (quick setup) to deep blue (painfully slow). Scan horizontally for which env hurts each team, vertically for org-wide hotspots (e.g., staging is darkest across the board).
- Call Out the Worst Cell: Start your stand-up or platform retro by circling the darkest square. Say: “Team Delta spends an average of 70 min just getting a staging box, what does that cost our sprint?”
- Compare Dev vs Staging: A good paved road shows a gentle gradient: dev < QA < staging. If dev is already dark, the whole pipeline is clogged. If only staging is dark, focus on release-grade data seeding, secrets, or infra quotas.
- Track Trend, Not Snapshot: Capture the same chart weekly; the real signal is whether colors lighten after each automation experiment. The chart by the way is just a reflection of what is happening; you still have to dive into why.
Step 5 – Automate the Self-Serve Fix
Wrap the most painful task, staging database spin-up, in a one-click script; measure the drop next sprint.
# File: create_staging_db.sh export TEAM=$1 az sql db create --name $TEAM-staging \ --service-objective S0 --zone-redundant false echo "DB ready 🎉" DevEx Gathering
Run Derby-Larsen’s Gather Data phase by posting the heat-map in stand-up and asking, “Which red cell surprises you most?” Let teams brainstorm blockers on sticky notes, cluster them by theme, then dot-vote a single automation to tackle. Close with a 15-minute time-box to pair on writing the first self-serve script.
See you tomorrow for Value-Stream Management 2025: Connecting DevEx, DORA and customer value!
Recap Links
Intro: Why People-Service-Profit Still Wins in Software
SUN: DevEx vs DORA and Why Both Matter
MON: DevEx vs. DORA-Platform Engineering & Flow
TUE: DevEx vs. DORA-Value Stream Management
WED: DevEx vs. Psychological Safety and Metrics
THU: DevEx Experience Library
FRI: DevOps and MLOps - The Next Frontier
SAT: DevEx ROI-Engineering Impact