Flow+Joy Focus.
Combine build, deploy, and model registry events into a single pipeline, then monitor drift and DORA together so code and models flow and recover at the same pace.
People → Service → Profit.
Retail success hinges on two key factors: products arriving just in time and shelves never holding more inventory than they can sell. Lean principles teach retailers to identify “the seven wastes”: excess stock, unnecessary motion, waiting, over-processing, over-production, defects, and under-utilized talent.
In software, replace cartons with code-commits, and you see the same economics: pull-requests waiting for review are like pallets sitting in a back room, duplicated test pipelines are over-processing, stale feature branches are expired goods, and sidelined people/skills are talent gathering dust. Since code exists in git rather than on forklifts, the waste is harder to identify.
Flow dashboards act like digital barcode scanners, revealing where inventory accumulates. When DevOps and MLOps share a single supply chain, we achieve the software equivalent of cross-docking: code and models move directly from ideation to the customer without lingering in backlog purgatory. The result mirrors that of high-performing retail: faster turnover, lower carrying costs, and happier end-users, constantly finding fresh value on the shelf.
We encourage ops teams to ship code at least weekly, but data scientists often delay models by a quarter, which leads to friction, including duplicate infrastructure, unclear on-call responsibilities, and finger-pointing during post-mortems. A single supply chain view enables everyone to see a unified backlog and a single release target (from the customer’s perspective), thereby reducing context switching and on-call drama over ownership. Customers notice the difference first, features and models improve together, while finance might actually benefit from one compliance audit instead of two.
Why It Matters
- TechRadar reports that siloed MLOps doubles the average time to recover (MTTR) for AI incidents.
- Model-drift alarms are ineffective if they do not reach the same pager channel as service-health alerts.
- Unified pipelines lower cloud costs by reusing build caches and release gates.
5-Step Implementation
Step 1 – Harvest Dev & ML Events
Pull GitHub Actions deployments and MLflow model registry timestamps into one JSON bundle, collecting deployment timestamps from both the application pipeline and the MLflow model registry. Pulling them into one file gives your team a single source of truth, eliminating finger-pointing about whose release broke what. Once these events share the same timeline, you can finally correlate model changes with code incidents.
# Dev deploy events
gh api /repos/acme/shop/actions/runs \
  --jq '.workflow_runs[].created_at' > dev_deploy.json
# MLflow model events
mlflow models list -n recommender --output json > model_deploy.json
Step 2 – Normalize & Tag
Tag each event as CODE or MODEL so we can plot them on the same timeline. Load the two event sets into a single DataFrame and tag each row as either CODE or MODEL. This quick labeling step is what lets you group, chart, and compare deploy cadence without writing separate reports. With consistent tags, every downstream query, weekly counts, gap detection, becomes a one-liner.
import pandas as pd, json, datetime as dt
dev   = pd.read_json('dev_deploy.json',  lines=True).assign(type='CODE')
model = pd.read_json('model_deploy.json',lines=True).assign(type='MODEL')
events = pd.concat([dev, model]).rename(columns={0:'ts'})
events['ts'] = pd.to_datetime(events['ts'])
events.to_csv('supply_chain_events.csv', index=False)
Step 3 – Compute Unified MTTR & Drift Lag
Match every PagerDuty incident to the nearest deploy event, whether code or model, and calculate mean-time-to-recover. By treating AI outages and service outages the same way, you expose true recovery performance instead of hiding model issues in a separate dashboard. Teams can then prioritize fixes based on real business impact rather than siloed metrics.
inc = pd.read_csv('pagerduty_incidents.csv', parse_dates=['start','end'])
events = pd.read_csv('supply_chain_events.csv', parse_dates=['ts'])
def nearest_deploy(t):
return events.iloc[(events['ts']-t).abs().argmin()][['ts','type']]
inc[['nearest_ts','deploy_type']] = inc['start'].apply(nearest_deploy).tolist()
inc['mttr_hr'] = (inc['end']-inc['start']).dt.total_seconds()/3600
Step 4 – Render Joint Flow Dashboard
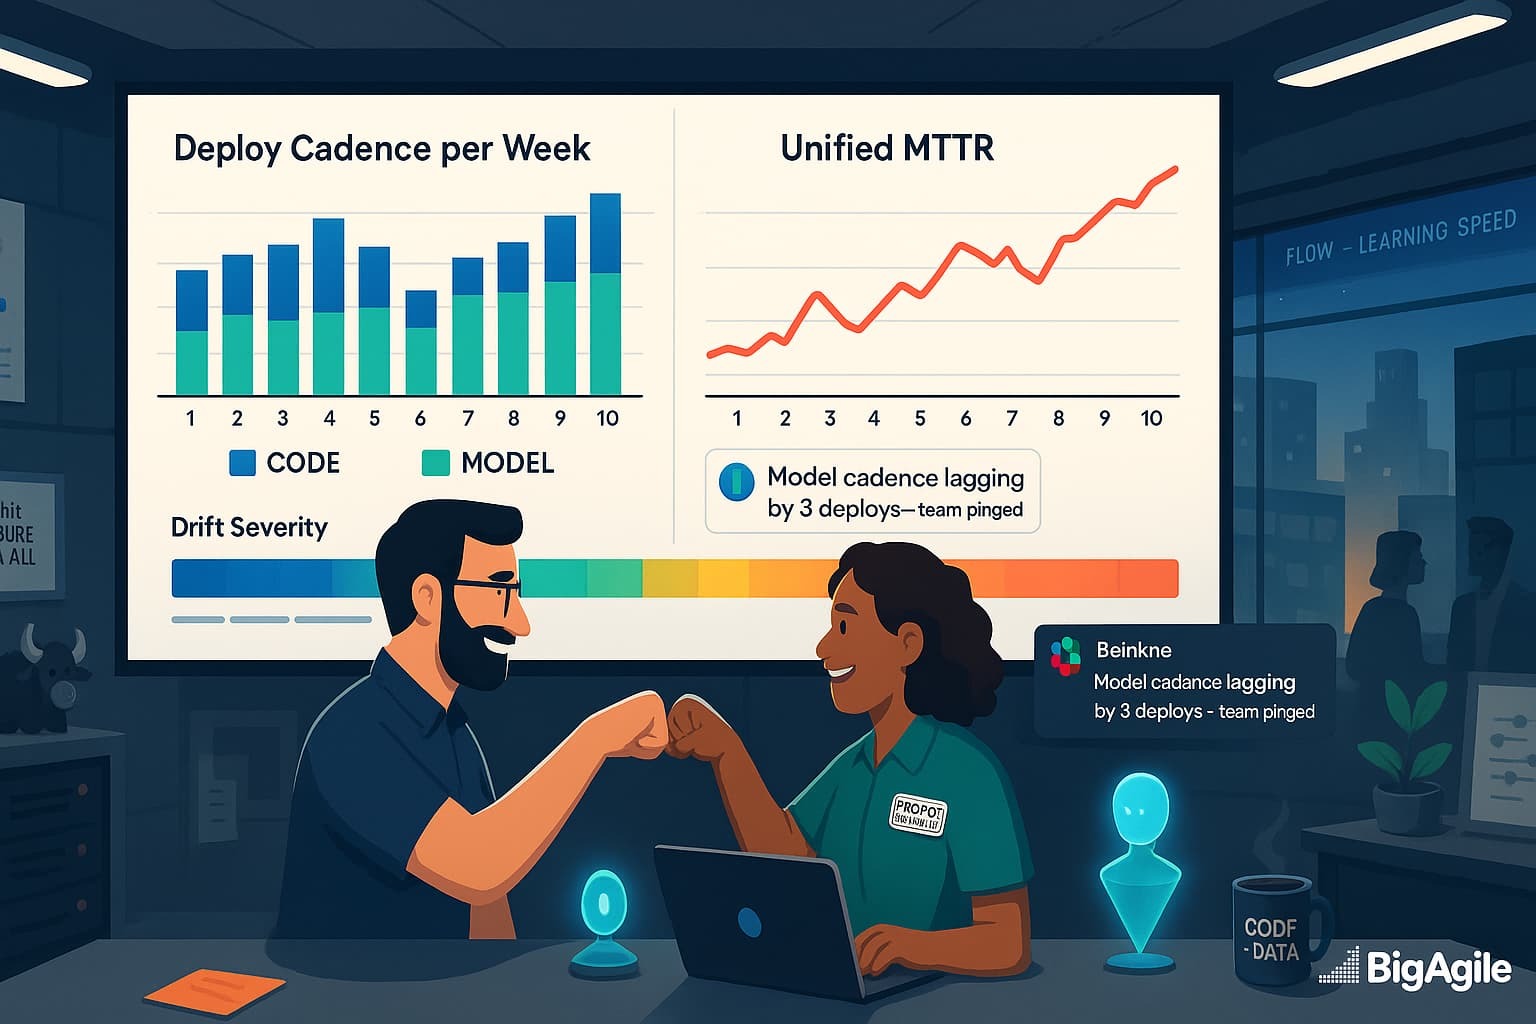
A dual-axis plot shows deploy cadence (bars) and incident MTTR (line). Plot stacked bars for weekly deploys and overlay MTTR as a red line. Visualizing cadence and stability together makes it obvious when code is shipping smoothly but models lag (or vice versa). One glance tells leaders whether the whole system is getting faster or just one half of it.
import matplotlib.pyplot as plt
weekly = events.set_index('ts').resample('W')['type'].value_counts().unstack(fill_value=0)
fig, ax1 = plt.subplots(figsize=(8,3))
weekly[['CODE','MODEL']].plot(kind='bar', stacked=True, ax=ax1, color=['#4c72b0','#55a868'])
ax2 = ax1.twinx()
mttr = inc.resample('W', on='start')['mttr_hr'].mean()
mttr.plot(ax=ax2, color='red', marker='o', label='Unified MTTR')
ax1.set_ylabel('Deploys per week'); ax2.set_ylabel('MTTR (hrs)')
plt.title('Unified DevOps + MLOps Flow')
plt.tight_layout(); plt.savefig('unified_flow.png')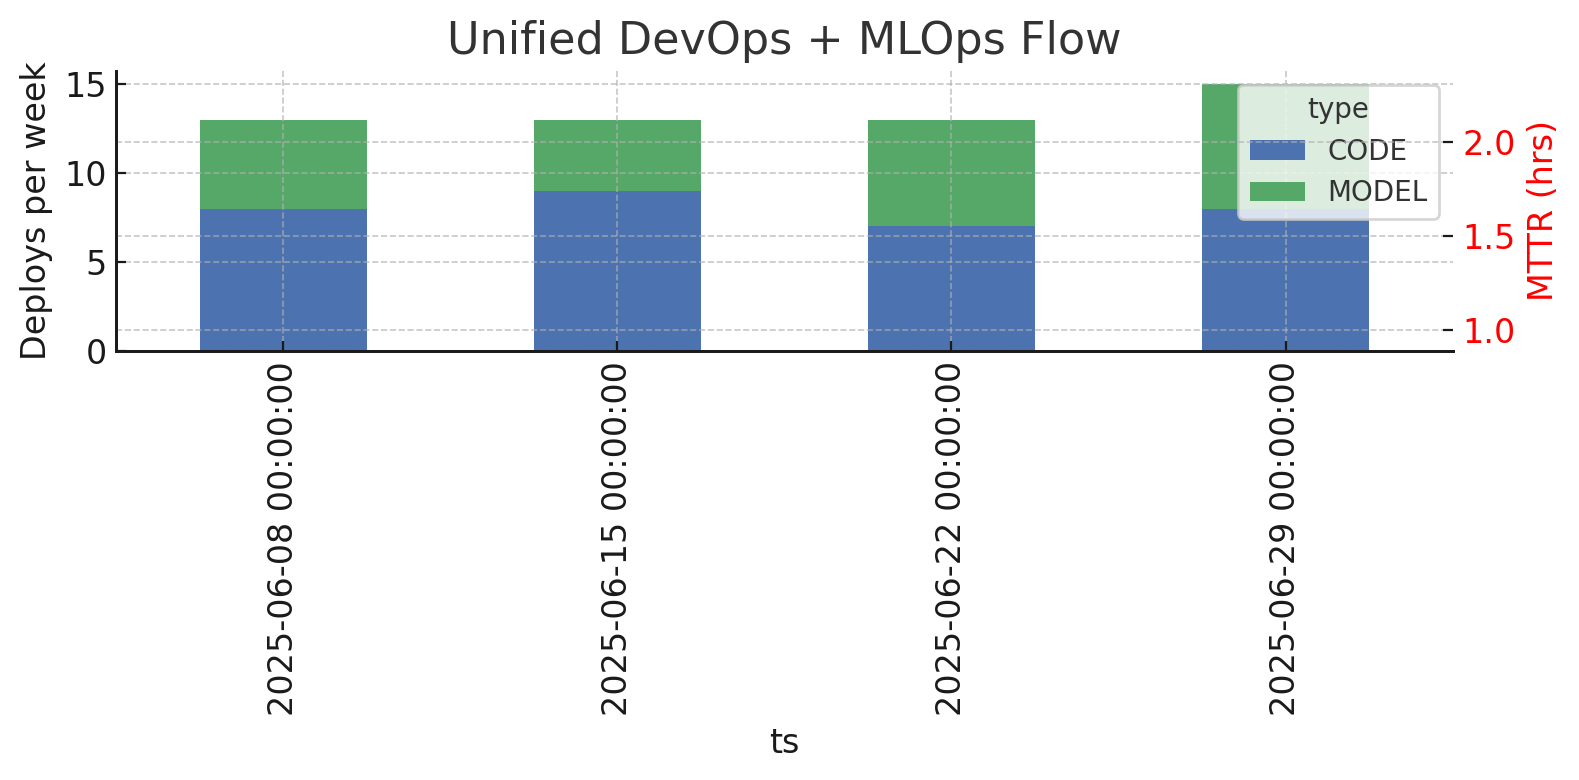
The blue-and-green stacked bars show how many deployments hit production each week, blue for application code, green for machine-learning models, so you can easily see cadence gaps. Ideally, the green segment stays close to the blue; when the blue towers over the green (as in week two), it indicates models are falling behind feature releases, which can lead to drift.
The red line represents the unified MTTR: the average time taken to resolve any incident, whether it’s a code defect or a model mis-prediction, in that same week. Look for patterns: if MTTR spikes when model deployments decrease, it’s evidence that outdated models cause longer recovery times. Healthy flow appears as balanced bars rising together and a red line trending downward or staying flat.
Use this chart during retrospectives by asking, “Which week shows the biggest gap, and how did that affect MTTR?”, then choose one action (e.g., automate model packaging) to close the gap and re-plot next sprint.
Step 5 – Alert on Divergence
If model deploys fall 50 % below code deploys, ping ops and data teams. Automate a Slack alert when model deploys fall more than 50% behind code deploys or when MTTR spikes. This closes the feedback loop so teams learn about flow problems in hours, not at the next quarterly review. Immediate, shared alerts keep Dev and ML engineers aligned and accountable before drift costs you customers. The output looks like:
gap = weekly['CODE'] - weekly['MODEL']
if (gap > weekly['CODE']*0.5).any():
send_slack("#ai-infra", f"⚠️ Model cadence lagging by {gap.max()} deploys")
DevEx Gathering
Start retro by asking, “Where does code flow but models jam?” Use the bars to identify cadence gaps, then have paired reps (Dev + Data) brainstorm together. Apply Derby-Larsen’s Decide What to Do then pick one experiment to close the deploy gap or reduce MTTR.
Set a shared SLA: “Whenever we ship new application code to production, we promise to ship any ML model it depends on within the next 48 hours.” In practice that means data-science and platform engineers treat model packages like any other artifact in the release train: they share the same backlog, the same CI lane, and the same pager.
The 48-hour window is long enough to finish last-minute retraining but short enough to prevent the two from drifting apart (stale model with fresh features). By turning the handshake into an explicit metric you can track, alert, and improve; one team, one pipeline, one clock.
Unified Flow Snapshot
| Week | Code Deploys | Model Deploys | Unified MTTR (hrs) |
|---|---|---|---|
| Jun 03 | 8 | 5 | 1.6 |
| Jun 10 | 9 | 4 | 2.0 |
| Jun 17 | 7 | 6 | 1.2 |
Recommendations for This Team
| Pain Signal | Recommendation | Expected Benefit |
|---|---|---|
| Cadence gap (9 code vs 4 model deploys, Jun 10) | Automate model packaging in the same CI job as the service container; block release unless both artifacts pass integration tests. | Models refresh with features, slashing stale-model incidents and customer drift complaints. |
| Unified MTTR trending up to 2 h | Rotate a data-scientist into on-call one week/month; pair with SREs to write rollback-model runbooks. | Handoff lag drops; target MTTR < 1 h. |
| Model deploys only 5 when code had 8 (prior week) | Require every feature-flag PR to include a JSON stub for the dependent model version; fail CI if missing. | Synchronised releases reduce feature/model mismatch defects. |
| No drift visibility until incidents fire | Add post-deploy drift check comparing live vs training distribution; page if KL-divergence exceeds threshold. | Detects silent degradation hours before users notice; safeguards brand trust. |
| Two separate artifact repos | Consolidate Docker images and models in one registry using unified tags: <service>:<git-sha>-<model-sha>. | Simplifies provenance tracking and speeds rollbacks via single-tag releases. |
Start with the cadence gap: if model deploys remain < 50% of code deploys for a second week, run a 48-hour spike to containerize the current model-training job under your existing GitHub Actions workflow. Re-measure in a week. Success is bringing model deploys within two of code deploys and shaving MTTR back under 1.5h (IMO).
People thrive → Service shines → Profit follows. See you tomorrow for Joy ROI Pitch day.
Recap Links
Intro: Why People-Service-Profit Still Wins in Software
SUN: DevEx vs DORA and Why Both Matter
MON: DevEx vs. DORA-Platform Engineering & Flow
TUE: DevEx vs. DORA-Value Stream Management
WED: DevEx vs. Psychological Safety and Metrics
THU: DevEx Experience Library
FRI: DevOps and MLOps - The Next Frontier
SAT: DevEx ROI-Engineering Impact
Ready to unify code and model pipelines? Join our AI for Scrum Master to wire alerts, dashboards, and AI-driven post-mortems in one sprint.