
Flow+Joy Focus.
Pair a public mood line and a “fail-of-the-week” board to encourage honesty, reveal hidden issues, and turn mistakes into learning opportunities. It’s that simple. Or is it? I find that most teams are either too busy or too scared to discuss their problems; the others are the ones who don’t think they can make a difference or lack the skills and knowledge to do so.
Again...Scrum Masters (agile coaches), this is where we earn our pay. We are the driving force of improvement within the organization (the undercurrent).
People → Service → Profit.
Developers shut down when every chart feels like a performance scorecard; innovation dies long before the sprint review. A shared, anonymized mood graph invites honest emotion and reveals stress spikes that the Scrum board can’t show. Addressing those spikes early prevents late-night heroics, keeps team members off “pager” duty, and protects profit through lower burnout and turnover. If our people aren’t safe to experiment, raise the flag, or feel free to discuss issues, improvements stall.
Why It Matters
Leaders who admit their mistakes first create the runway for everyone else. This mirrors the Agile Alliance guidance that psychological safety starts with leadership vulnerability.
- Google’s Project Aristotle found psychological safety the #1 predictor of team success.
- LinearB reports 52% of engineers hide blockers to avoid blame.
- Teams that celebrate failure deploy 17% more often, mistakes surface fast, fixes faster.
5-Step Implementation
Step 1 – Export Slack Mood Data
Pull last 14 days of channel messages so we can mine emoji and keyword sentiment.
# Slack history: replace CHANNEL_ID curl -H "Authorization: Bearer $SLACK_TOKEN" \ "https://slack.com/api/conversations.history?channel=CHANNEL_ID&limit=1000" \ > slack_msgs.json Step 2 – Compute Daily Mood Score
Convert emoji and keywords into a –1…+1 scale, then roll up per day.
import pandas as pd, json, datetime as dt, re msgs = json.load(open('slack_msgs.json'))['messages'] rows=[] for m in msgs: ts = dt.datetime.fromtimestamp(float(m['ts'])) text = m.get('text','') score = text.count(':smile:') - text.count(':sad:') score += len(re.findall(r'\b(stuck|blocked)\b', text))*-1 rows.append({'date': ts.date(), 'score': score}) df = pd.DataFrame(rows).groupby('date')['score'].sum().reset_index() df.to_csv('mood_sample.csv', index=False)
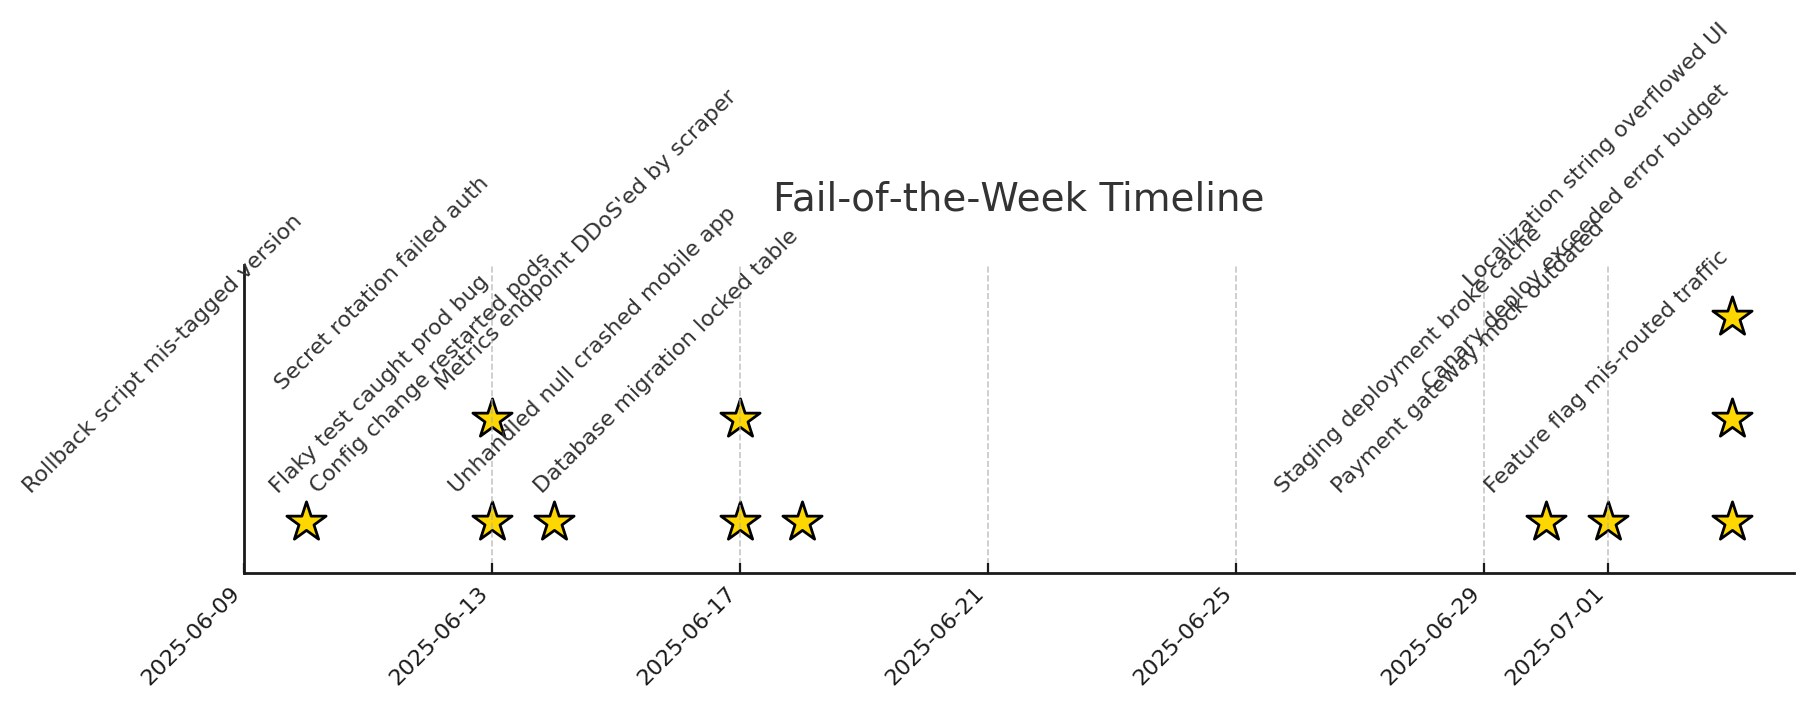
Step 3 – Log Failure Wins
Track every failure celebration in a simple CSV to show learning tempo.
| Date | Star | Failure Description |
|---|---|---|
| 2025-06-12 | ⭐ | Unhandled null crashed mobile app |
| 2025-06-13 | ⭐ | Feature flag mis-routed traffic |
| 2025-06-14 | ⭐ | Config change restarted pods |
| 2025-06-16 | ⭐ | Localization string overflowed UI |
| 2025-06-17 | ⭐ | Staging deployment broke cache |
| 2025-06-18 | ⭐ | Metrics endpoint DDoS'ed by scraper |
| 2025-06-19 | ⭐ | Flaky test caught prod bug |
| 2025-06-21 | ⭐ | Rollback script mis-tagged version |
| 2025-06-22 | ⭐ | Canary deploy exceeded error budget |
| 2025-06-23 | ⭐ | Secret rotation failed auth |
| 2025-06-24 | ⭐ | Payment gateway mock outdated |
| 2025-06-27 | ⭐ | Database migration locked table |
// File: failure_log.csv date,description,impact_lessons 2025-06-17,Staging deployment broke cache,Added health check 2025-06-19,Flaky test caught prod bug,Enabled retry with backoff Step 4 – Visualize Mood & Failure Markers
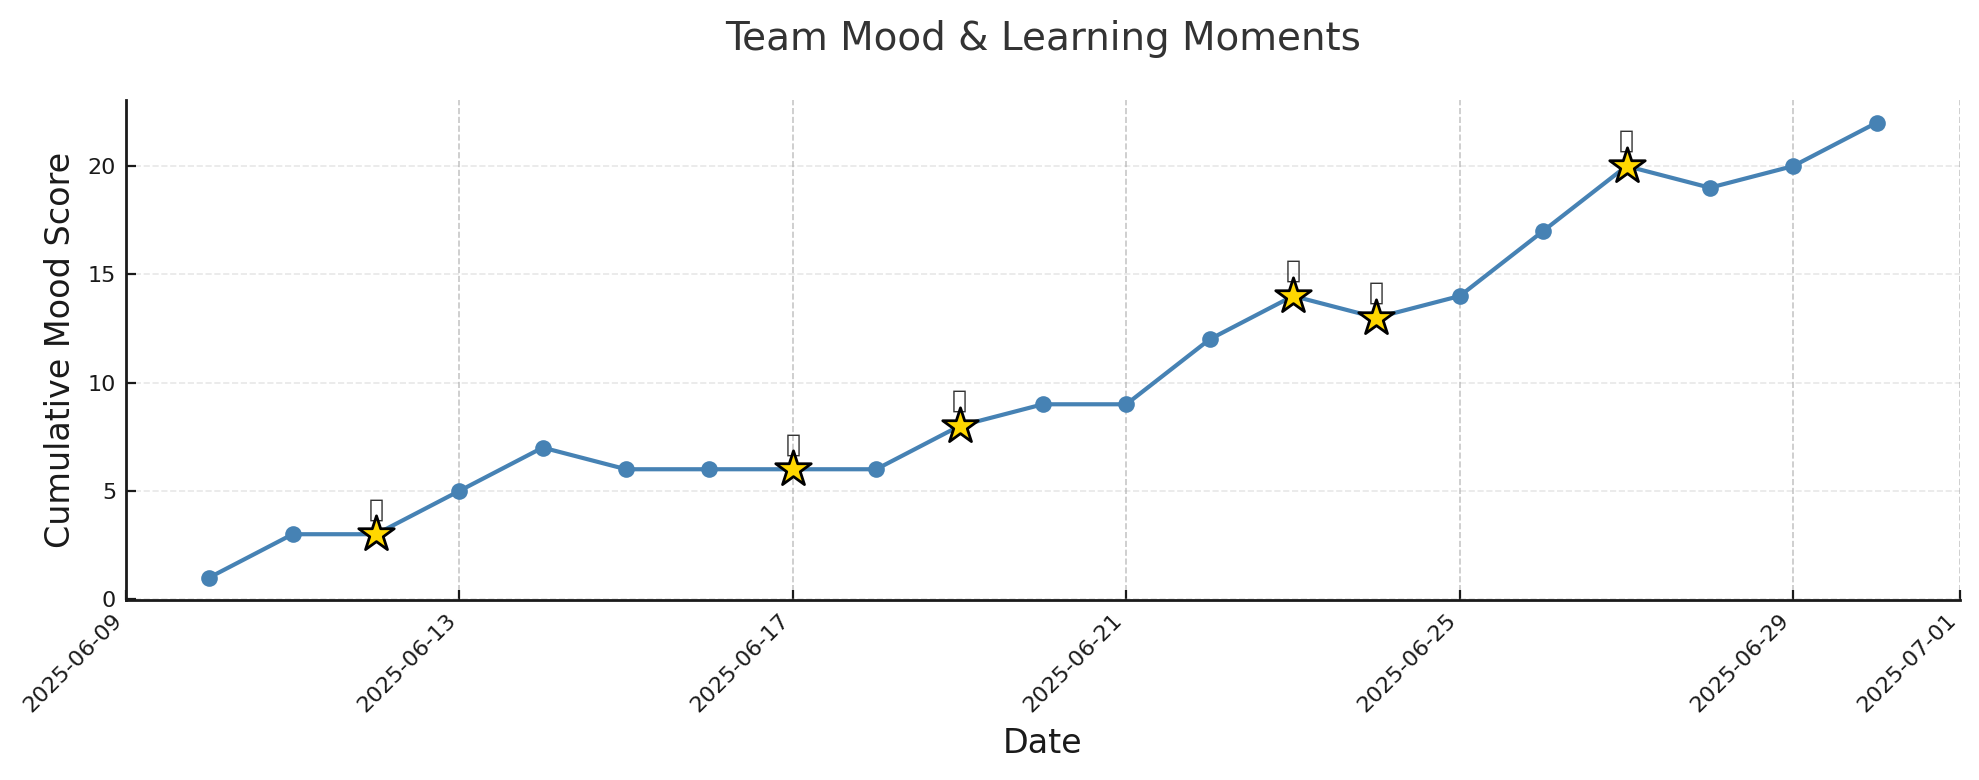
Overlay mood line with star icons for each celebration, then save PNG
import matplotlib.pyplot as plt fail = pd.read_csv('failure_log.csv', parse_dates=['date']) plt.plot(df['date'], df['score'].cumsum(), marker='o', label='Mood Index') for _, r in fail.iterrows(): plt.scatter(r['date'], df[df['date']==r['date']]['score'].cumsum(), marker='*', color='gold', s=150) plt.axhline(0, color='grey', linewidth=.5); plt.grid(axis='y', alpha=.2) plt.title('Team Mood & Learning Moments'); plt.ylabel('Cumulative Score') plt.tight_layout(); plt.savefig('mood_line.png') Step 5 – Share & Celebrate
Post the PNG in the retro channel; pin a “Fail of the Week” thread so learning moments stay visible and safe.
Each gold star marks a celebrated failure; stacked stars indicate multiple learnings on the same day. Use this view in retros to spark story-sharing without visual clutter.
DevEx Gathering
Kick off Set the Stage by reading the Prime Directive:
"Regardless of what we discover, we understand and truly believe that everyone did the best job they could, given what they knew at the time, their skills and abilities, the resources available, and the situation at hand."
Then show the mood line. Ask, “What happened here?” at the dip; let silence do the heavy work (count to 1,000 in your head if you have to). During Generate Insights invite storytellers to explain stars, reinforcing that failures are our currency, not shame. Close with an appreciation round: each dev thanks someone for a candid share, sealing trust for the next sprint.
How the Scrum Master could frame it
- Open with shared purpose: “We’re here to see the system, not score the people.”
- Show blameless metrics: Mood line, no individual labels.
- Invite stories: “Who can share what happened on the biggest dip?”
- Celebrate learning: Place a gold star on the failure board; applaud.
- Pick one experiment: Make it specific, time-boxed, and team-owned.
Candid metrics lose their power if they silence the people behind them. By pairing mood graphs with a Fail-of-the-Week board, you turn raw data into safe invitations for honest stories, quick experiments, and shared growth. Keep celebrating every starred misstep, and watch team confidence, along with delivery speed, rise sprint after sprint. It's not a short-game, its the long-game; be patient.
People thrive → Service shines → Profit follows. See you tomorrow for DevEx Scorecard day.
Recap Links
Intro: Why People-Service-Profit Still Wins in Software
SUN: DevEx vs DORA and Why Both Matter
MON: DevEx vs. DORA-Platform Engineering & Flow
TUE: DevEx vs. DORA-Value Stream Management
WED: DevEx vs. Psychological Safety and Metrics
THU: DevEx Experience Library
FRI: DevOps and MLOps - The Next Frontier
SAT: DevEx ROI-Engineering Impact