Flow+Joy Focus
Long pull-request wait times erode developer happiness and inflate lead time; measuring them daily turns quiet frustration into actionable flow fixes.
People → Service → Profit.
When reviews linger, developers context-switch, confidence drops, and conversations move to side channels. Lower morale bleeds into our service: stalled reviews delay deploys, bug fixes pile up, and customers wait. Shorten review-wait and everything else moves: faster merges, earlier feedback, happier users, profit’s most reliable pathway.
Why It Matters
- 56% of teams cite “waiting on reviews” as their top DevEx pain.
- Idle PRs disguise scope creep and siloed expertise.
- Review-wait > p.90 is a leading indicator of weekend hot-fixes.
- Transparent metrics let Scrum Masters swarm the queue issues instead of nudging inboxes.
5-Step Implementation
The five-step playbook is a flexible pattern you can use with any stack, whether it's GitHub, GitLab, or Azure Repos. The process is the same: fetch raw pull-request events, normalize timestamps, calculate review wait times, flag outliers, and share a chart everyone can see.
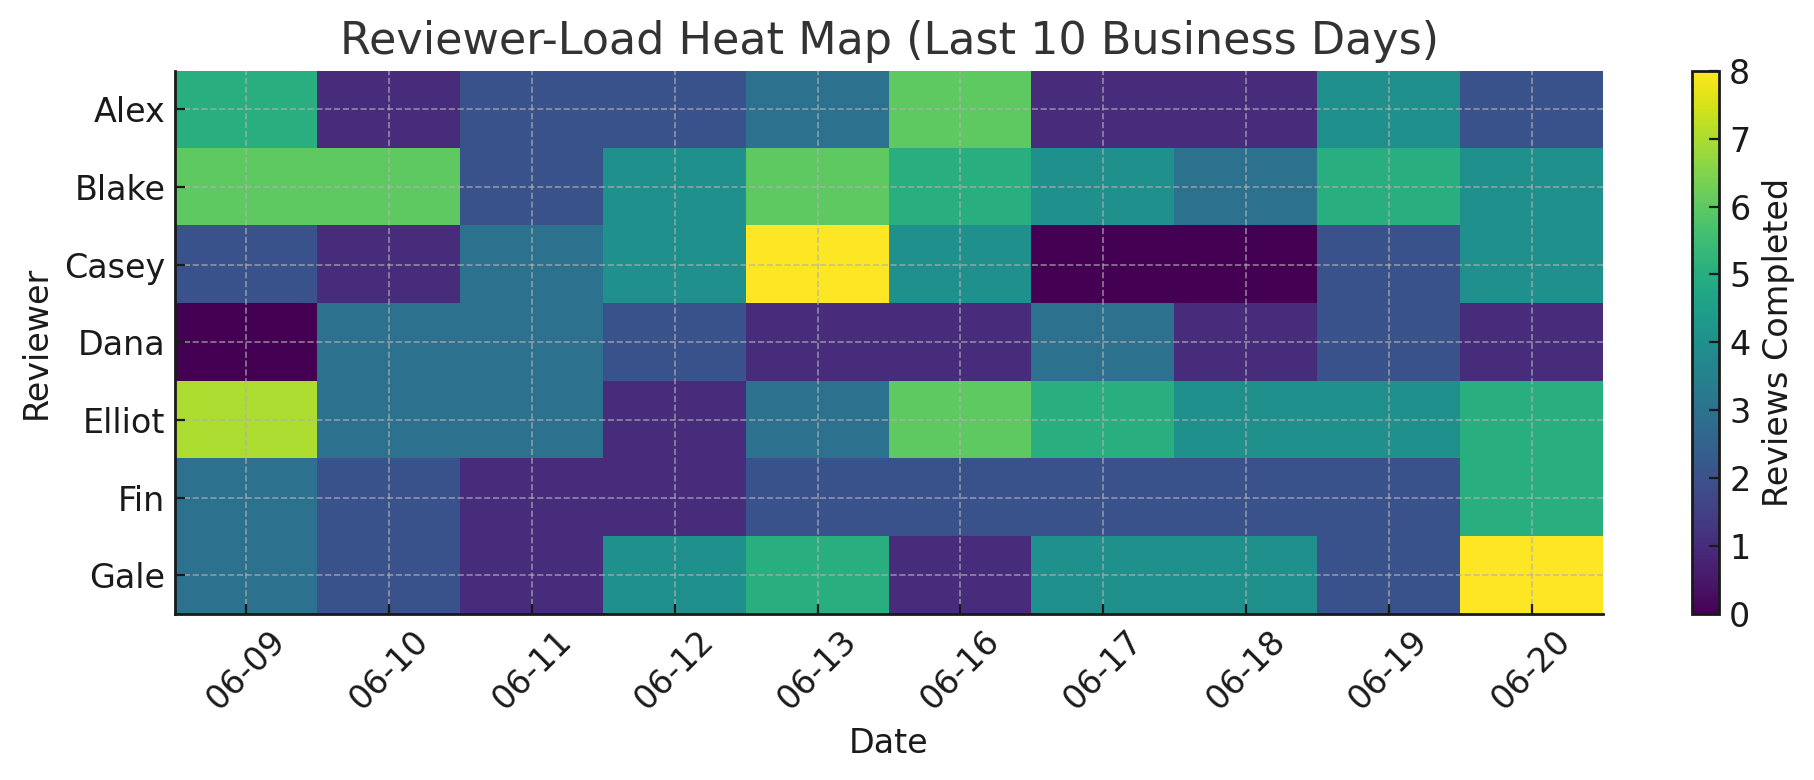
This visual shows "merge-queue gravity," which is the unseen force that keeps tasks with senior reviewers while newer teammates wait. At first, this imbalance might feel safe, but it slows down progress and holds back skill development. By pointing out wait hotspots and rotating responsibilities, you encourage better review practices, reduce burnout, and build trust in rising engineers.
In short, this script isn't just about managing data; it's a step toward healthier collaboration.
Step 1-Pull Raw PRs: Grab merged PR data for the last sprint.
Start by collecting all closed pull requests from your repo’s API. This provides an objective record of when work entered and left the review queue, an undeniable baseline.
curl -H "Authorization: Bearer $GH_TOKEN" \ "https://api.github.com/repos/Acme/Store/pulls?state=closed&per_page=100" \ > prs.json Step 2-Normalize Timestamps: Load to pandas & parse dates.
Loading the JSON into pandas and parsing dates converts raw events into clear, sortable data. Using consistent timestamps allows you to stack, slice, or join the dataset with sprint boards or CI logs later.
import pandas as pd, json, datetime as dt df = pd.json_normalize(json.load(open('prs.json'))) for col in ('created_at','merged_at'): df[col] = pd.to_datetime(df[col])
Step 3-Add First-Review Time: One API call per PR.
Computing wait_min creates the key metric: minutes from PR creation to first review. Saving it to review_wait_sample.csv enables version control, sharing with analysts, or integrating into the heat-map notebook.
import requests, os def first_review(iid): r = requests.get(f"https://api.github.com/repos/Acme/Store/pulls/{iid}/reviews", headers={"Authorization":f"Bearer {os.getenv('GH_TOKEN')}"}) j = r.json() if j: return pd.to_datetime(j[0]['submitted_at']) df['first_review_at'] = df['number'].apply(first_review) Step 4-Compute Review Wait & Alert: Anything over P90 pings Slack.
By flagging anything above the 90th percentile, you highlight the most significant bottlenecks without blaming anyone. These outliers become your action items—review large PRs, auto-assign reviewers, or pair juniors with seniors.
df['wait_min'] = (df['first_review_at']-df['created_at']).dt.total_seconds()/60 p90 = df['wait_min'].quantile(.90) laggers = df[df['wait_min']>p90][['number','wait_min']] Step 5-Post Quick Chart: Save a histogram PNG for stand-up.
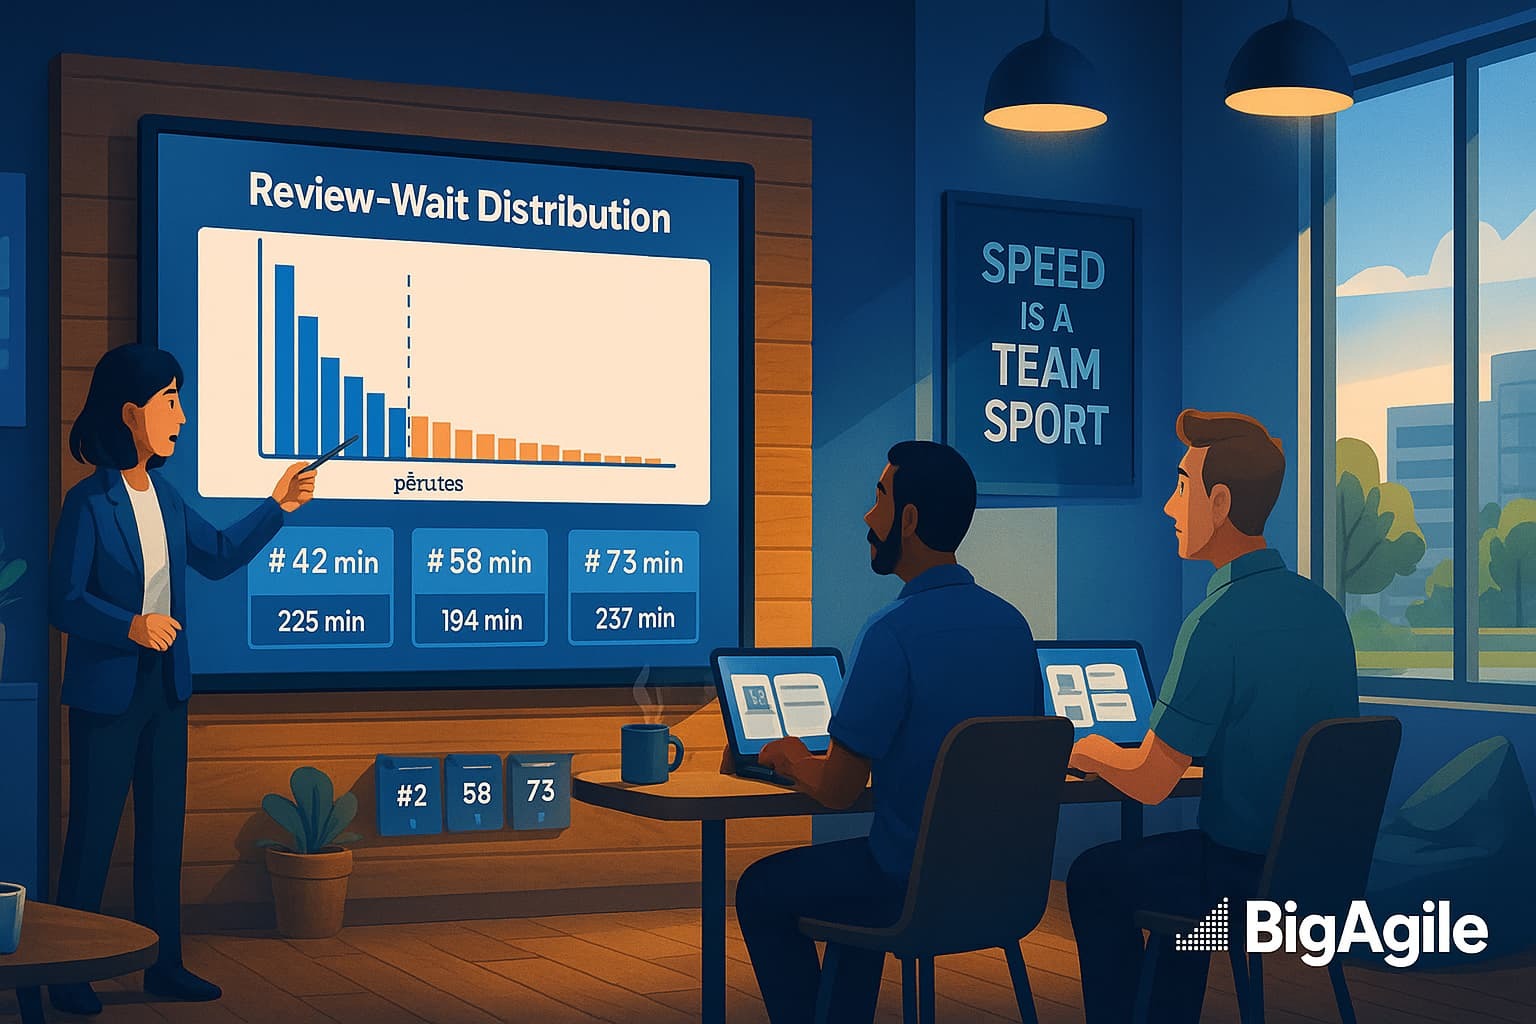
Finally, a histogram (or heat map) visualizes the data so everyone on the team can understand it instantly. Bring it to stand-up to spend less time guessing who’s blocked and more time redistributing review workload to keep learning and progress flowing.
import matplotlib.pyplot as plt plt.hist(df['wait_min'], bins=15, edgecolor='black') plt.axvline(p90, color='red', linestyle='--') plt.title('PR Review-Wait Distribution') plt.xlabel('Minutes'); plt.ylabel('PR Count') plt.tight_layout(); plt.savefig('review_wait_hist.png')
DevEx Gathering
Kick off the retro by showing the histogram, then silently ask each developer to jot down one cause and one fix for red-zone PRs. Cluster the causes, dot-vote on the fixes, and commit to a single experiment (e.g., "auto-assign reviewers within 5 minutes"). Tie the experiment to the Service layer, lead-time impact, and revisit it next sprint. This keeps the data factual and the conversation blameless.
Check out the next post for Platform Engineering & Flow: Reduce cognitive load so teams focus on features!
Recap Links
Intro: Why People-Service-Profit Still Wins in Software
SUN: DevEx vs DORA and Why Both Matter
MON: DevEx vs. DORA-Platform Engineering & Flow
TUE: DevEx vs. DORA-Value Stream Management
WED: DevEx vs. Psychological Safety and Metrics
THU: DevEx Experience Library
FRI: DevOps and MLOps - The Next Frontier
SAT: DevEx ROI-Engineering Impact