Flow+Joy Focus.
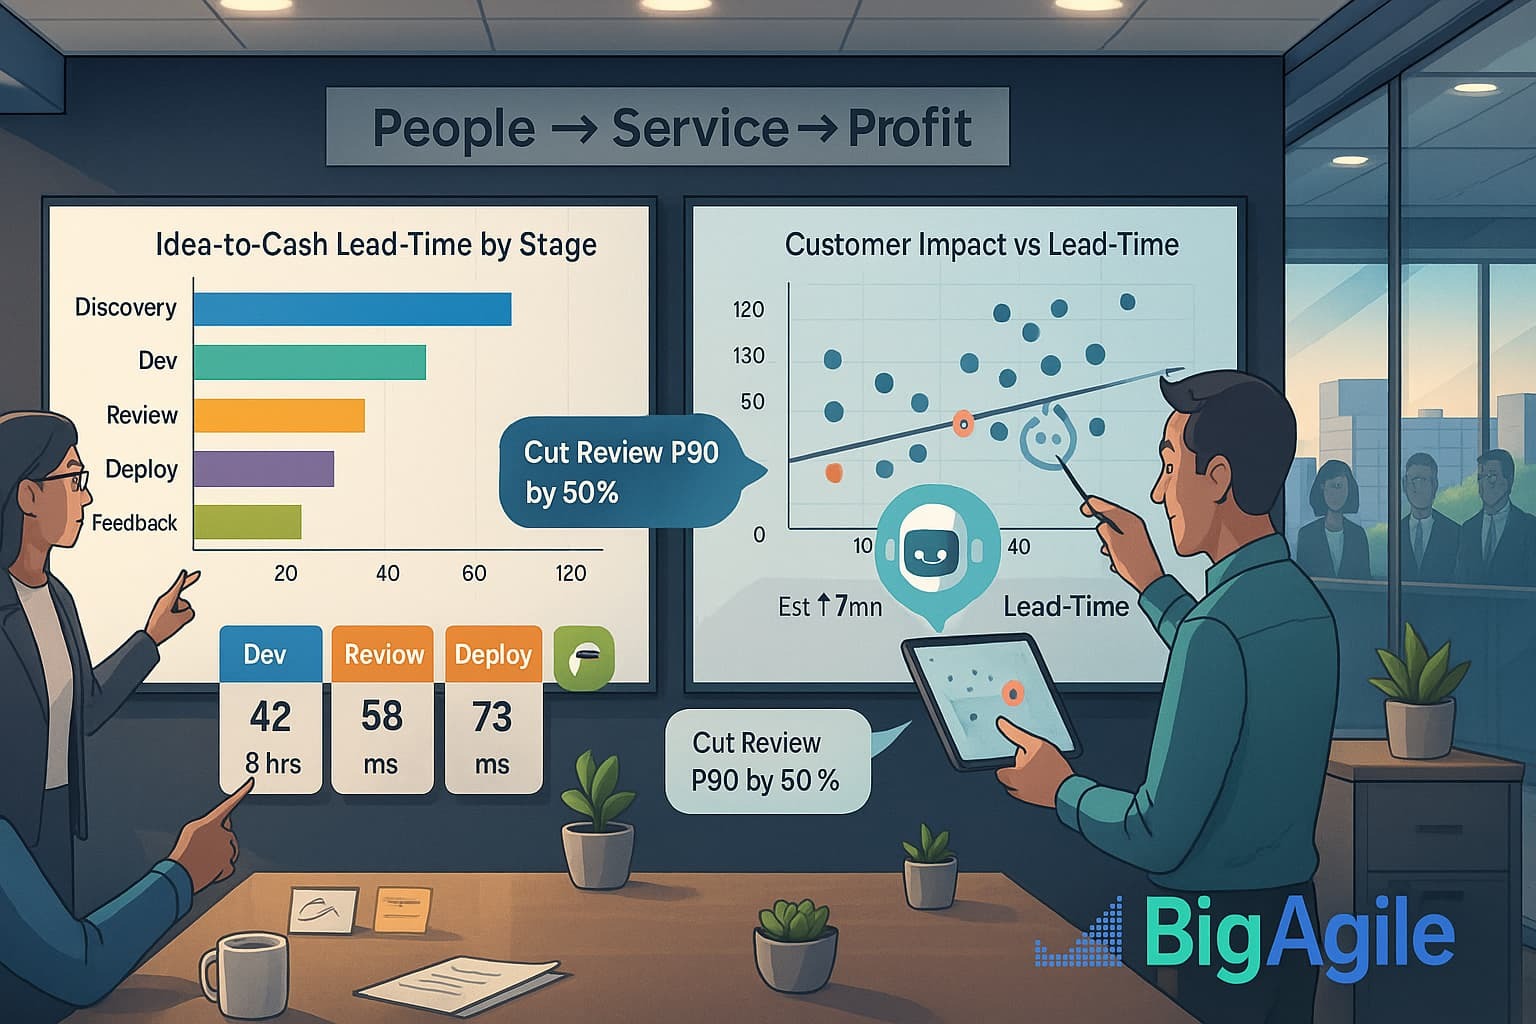
Mapping idea-to-cash lead time by stage reveals where Flow stalls and whether shipped features truly impact the customer. I mean, that is really the only reason we build a product, to serve our customers and make an impact, right? So if we can focus our development efforts around that concept, you’re way ahead of your competitors (probably).
People → Service → Profit.
Backlogs are hidden behind dozens of Jira (or your tool’s) statuses, but customers only focus on “problem solved.” That can come from innovation, defect resolution, minor enhancements, or even engineering and maintenance work. Visualizing the value stream allows teams to see where human effort gets lost in wait times, handoffs, approvals, and roadmap delays. Removing those queues improves service: features are delivered faster, support teams can breathe, and customers stay loyal. Shorter, clearer value paths reduce the cost of delay, freeing up budget for the next investment that drives profit.
Why It Matters
- Broadcom’s 2025 VSM report predicts 70% of enterprises will tie flow metrics to customer-impact KPIs within two years.
- Without stage-level lead time, you can’t tell if DevOps speed hides weeks of fuzzy “Discovery.”
- Linking feature usage to stream stages highlights which delays truly hurt users and revenue (a no no).
5-Step Implementation
Step 1 – Export Tickets
Pull the last two sprints’ issues from Jira (or ADO) with history so we capture every status change.
jira export --jql "project = PROD AND updated >= -14d" \ --fields "key,status,created,updated,customfield_stage" \ --output issues.json Step 2 – Map to Value-Stream Stages
Normalize statuses into five canonical stages: Discovery, Dev, Review, Deploy, Feedback.
import pandas as pd, json raw = pd.json_normalize(json.load(open('issues.json'))) stage_map = {"To Do":"Discovery","In Progress":"Dev","In Review":"Review", "Merged":"Deploy","Done":"Feedback"} raw['stage'] = raw['status'].map(stage_map) raw.to_csv('idea_to_cash_sample.csv', index=False) Step 3 – Calculate Stage Lead Time
Turn change-history into minutes spent in each stage per ticket. Here is a sample file you can feed into the next step.
df = pd.read_csv('idea_to_cash_sample.csv', parse_dates=['created','updated']) lead = (df.groupby(['key','stage'])['updated'] .apply(lambda s: s.max()-s.min()) .dt.total_seconds()/3600).unstack(fill_value=0) lead.to_csv('vsm_leadtime.csv') Step 4 – Visualize the Stream
A stacked horizontal bar chart shows which phases dominate total lead time.
import matplotlib.pyplot as plt lead.sum().plot(kind='barh', stacked=True, figsize=(8,3)) plt.title('Idea-to-Cash Lead-Time by Stage (hrs)') plt.xlabel('Hours'); plt.tight_layout() plt.savefig('vsm_bar.png') 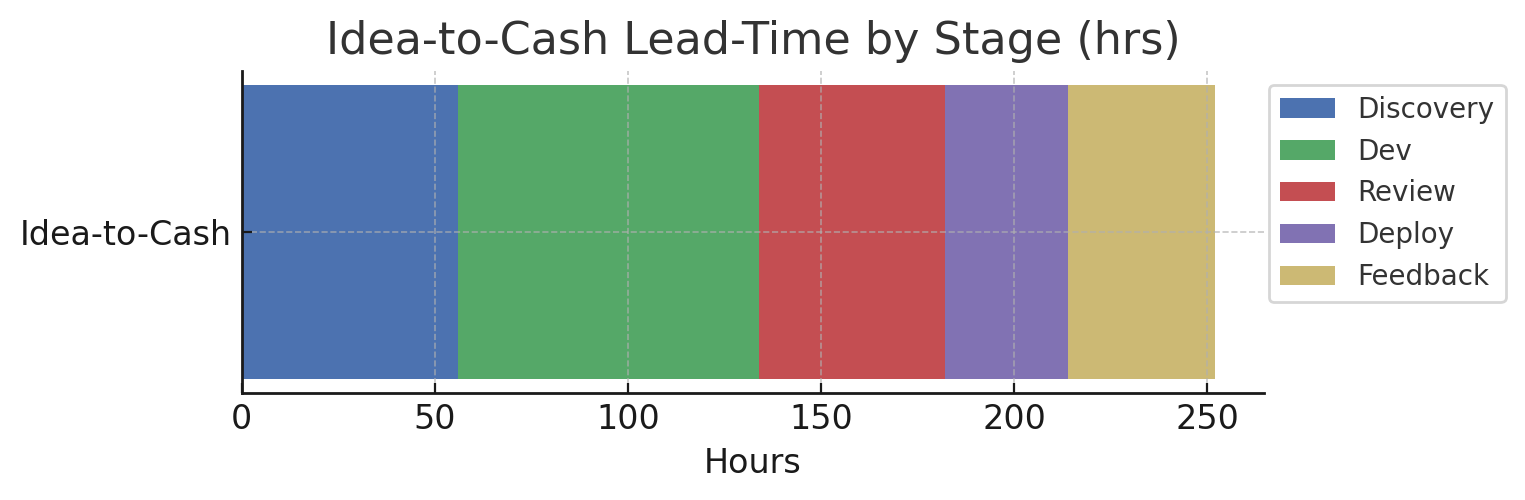
How to Read the Lead-Time Bar
- Left-to-Right Flow: The bar is stacked in process order: Discovery → Dev → Review → Deploy → Feedback.
- Segment Length: Each colored segment’s width equals total hours the stream spent in that stage across the last two sprints. The longest slice—green Dev at 78 h—dominates the timeline.
- Quick Diagnosis:
- Ask two questions:
- Which stage is widest? That’s your prime delay.
- Does segment order match reality? If Feedback is longer than Deploy, you’re learning too slowly.
- Ask two questions:
- Target Line: Overlay a vertical goal (e.g., 120 h). Everything right of that line is cost of delay.
- Use in Stand-Up: Point at the thickest segment, brainstorm one experiment to shave 10 %, and track progress on next week’s bar.
Step 5 – Tie to Customer Outcomes
Join feature-flag analytics (adoption %, NPS delta) to each ticket and sort by ROI per hour.
usage = pd.read_csv('feature_usage.csv') # id, adoption_pct, nps_gain roi = lead.sum(axis=1).reset_index().merge(usage, on='key') roi['roi_per_hr'] = roi['adoption_pct']/roi['updated'] top = roi.sort_values('roi_per_hr', ascending=False).head(10) DevEx Gathering
Use Derby-Larsen’s Generate Insights step to ask: “Which stage steals the most time yet delivers the least customer impact?” Let teams brainstorm experiments, trunk-based Dev, earlier usability tests, auto-deploy previews. Time-box to one high-ROI change; revisit lead-time bar next retro.
Lead Time Snapshot
| Stage | Total Hours | % of Stream |
|---|---|---|
| Discovery | 56 | 22 % |
| Dev | 78 | 31 % |
| Review | 48 | 19 % |
| Deploy | 32 | 12 % |
| Feedback | 38 | 16 % |
People thrive → Service shines → Profit follows. See you tomorrow for Psychological Safety + Metrics.
Recap Links
Intro: Why People-Service-Profit Still Wins in Software
SUN: DevEx vs DORA and Why Both Matter
MON: DevEx vs. DORA-Platform Engineering & Flow
TUE: DevEx vs. DORA-Value Stream Management
WED: DevEx vs. Psychological Safety and Metrics
THU: DevEx Experience Library
FRI: DevOps and MLOps - The Next Frontier
SAT: DevEx ROI-Engineering Impact